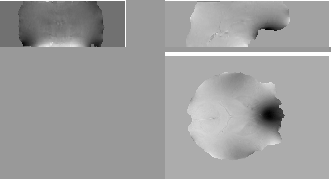
In this section some example images are shown to illustrate how the algorithm works.
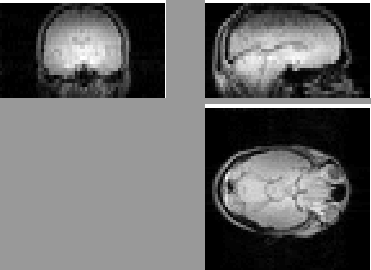
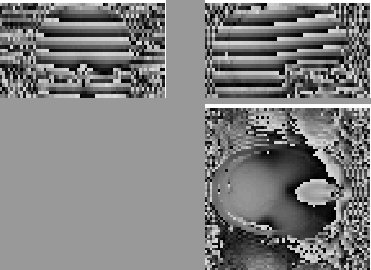
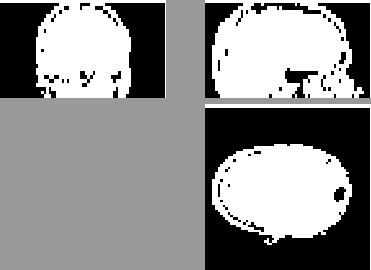
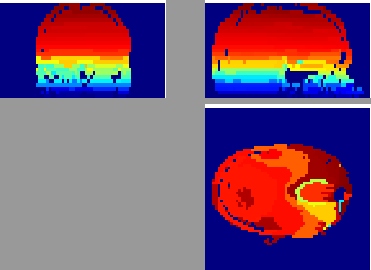
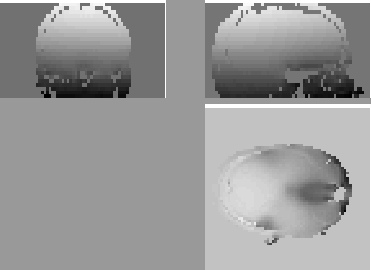
Consider the corresponding magnitude and phase images shown in figures 1 and 2. By thresholding the magnitude image at a robust threshold1 a mask is calculated, as shown in figure 3. Regions are then created and labelled, excluding the masked out areas, as shown in figure 4. Finally the region merging algorithm is used to unwrap the phase, with the result shown in figure 5. Note that for this image there were 1920 regions created (using 6 phase partitions) which is substantially less than 102400 voxels in the image or 31566 voxels within the mask. Furthermore, of the regions created 1102 were single voxels, while only 163 were larger than 27 voxels. The total time for unwrapping was 1.7 seconds on a desktop PC.
The next example shows the performance on high resolution images.
This venogram image is 512 ![]() 512
512 ![]() 64 with voxel
dimensions of 0.38mm
64 with voxel
dimensions of 0.38mm ![]() 0.50mm
0.50mm ![]() 1.12mm.
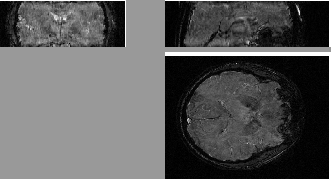
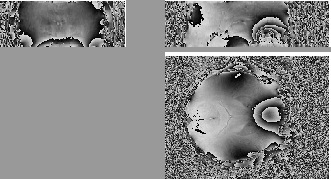
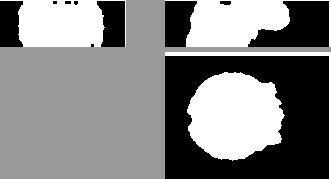
Figures 6, 7, 8
and 9 show the magnitude, wrapped phase, mask and
unwrapped phase images respectively. Note that for this large image
the regions were restricted to be planar (in order to that reduce the
chance of two areas of differing phase offset being connected together
by small chains of noisy voxels -- see discussion) and the processing
time was slightly over an hour.
1.12mm.
Figures 6, 7, 8
and 9 show the magnitude, wrapped phase, mask and
unwrapped phase images respectively. Note that for this large image
the regions were restricted to be planar (in order to that reduce the
chance of two areas of differing phase offset being connected together
by small chains of noisy voxels -- see discussion) and the processing
time was slightly over an hour.