Example Box: Resting State fMRI Networks
Introduction
The aim of this example is to become more familiar with what resting state fMRI networks and artifacts looks like, based on the results from an independent component analysis (ICA) of a single subject's data.
This example is based on tools available in FSL, and the file names and instructions are specific to FSL. However, similar analyses can be performed using other neuroimaging software packages.
Please download the dataset for this example here:
Data download
The dataset you downloaded contains the following files:
- Pre-processed resting state fMRI images:
filtered_func_data.nii.gz - A directory containing the results of an ICA analysis:
filtered_func_data.ica
Viewing the Data
To start with load the data into a viewer (e.g. fsleyes). This is easiest to do from a terminal (after changing directory with cd to the directory with this data) by running:
fsleyes --scene melodic -ad filtered_func_data.ica &
which will open a window that shows the ICA result (coloured) on top of the brain (in grey) along with the timeseries and the frequency spectrum of the component (at the bottom). Note that the same thing can be achieved through the GUI alone, using View --> Perspectives --> MELODIC mode. In other viewers the main data file to be loaded is melodic_IC.nii.gz which contains the spatial maps, with other text files containing information about the timecourses and frequency spectra.
Flick through some different components by highlighting the "melodic_IC" in the Overlay list and then changing the "Volume" number. You will see a range of very different spatial maps, timecourses and frequency spectra. Try adjusting the "slice spacing" and surrounding controls so that you can see a good range of slices, covering most of the brain.
In this case we do not have a set of predefined labels for all components, so you should flick through the different components to find some cases of interest. For instance, you should be able to find some clear resting state networks as well as motion and cardiac artifacts. See if you can find ones matching the images below as well as other identifiable networks and artifacts.
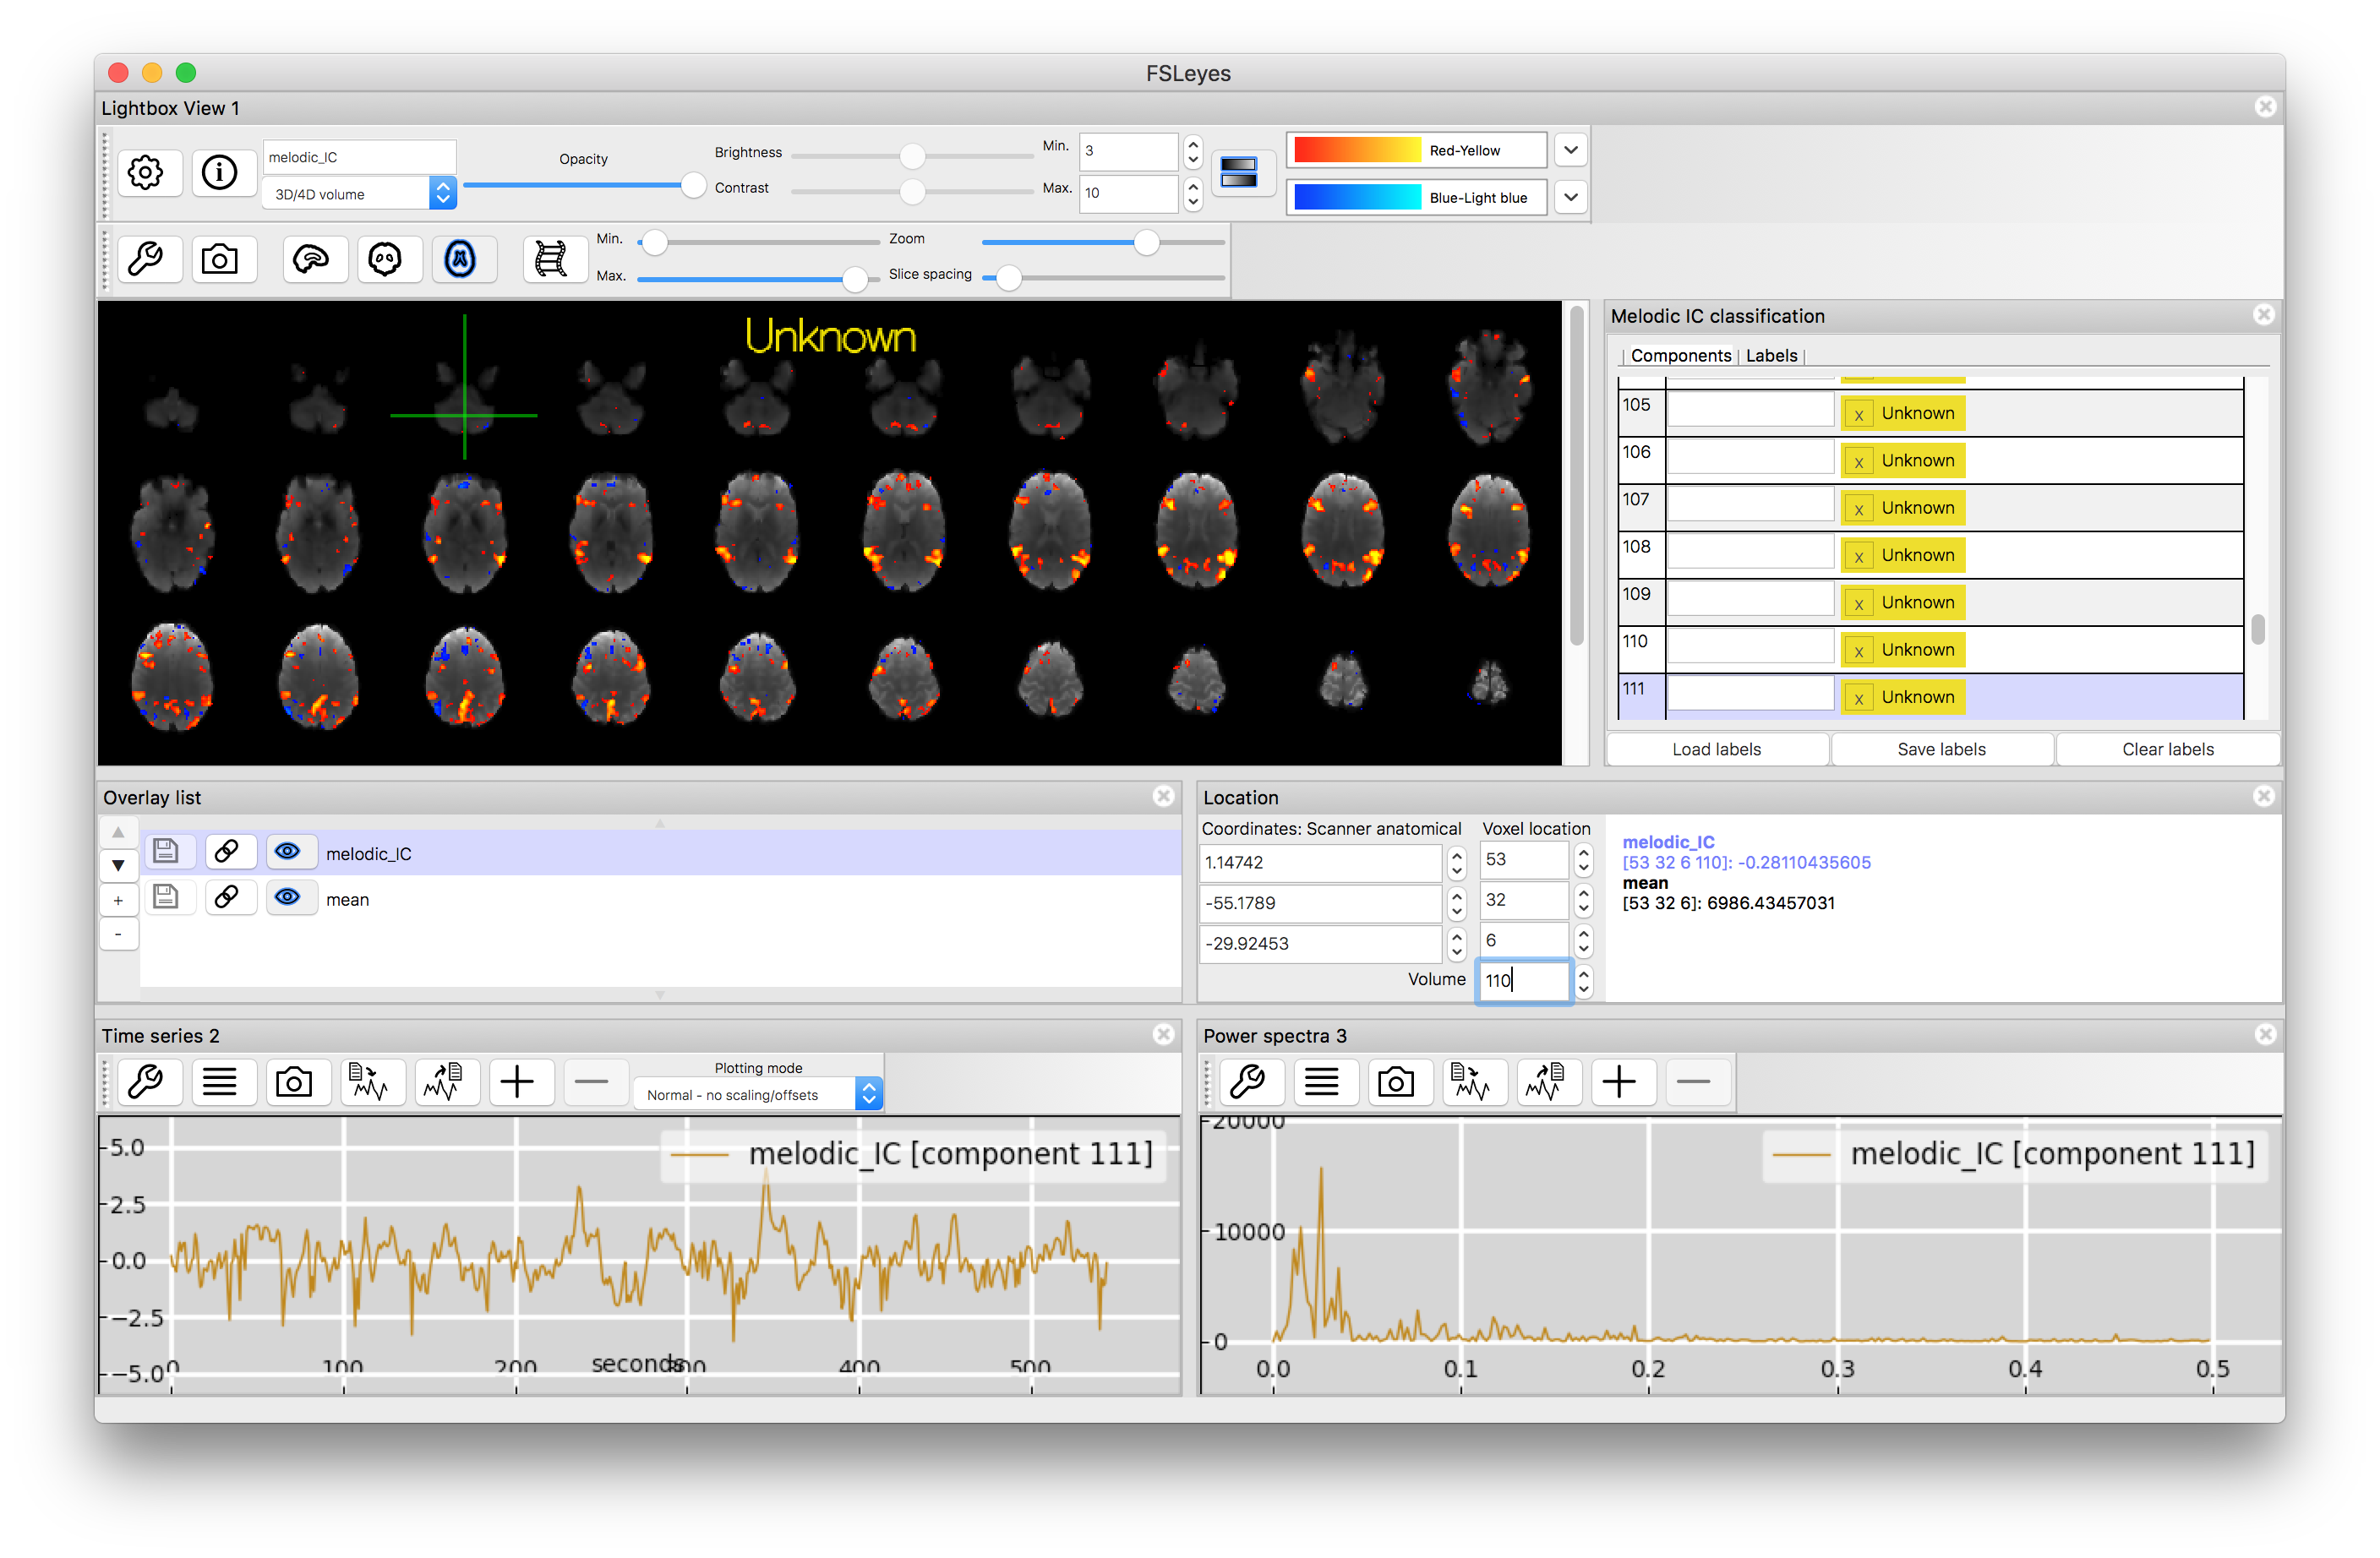
Resting State Network
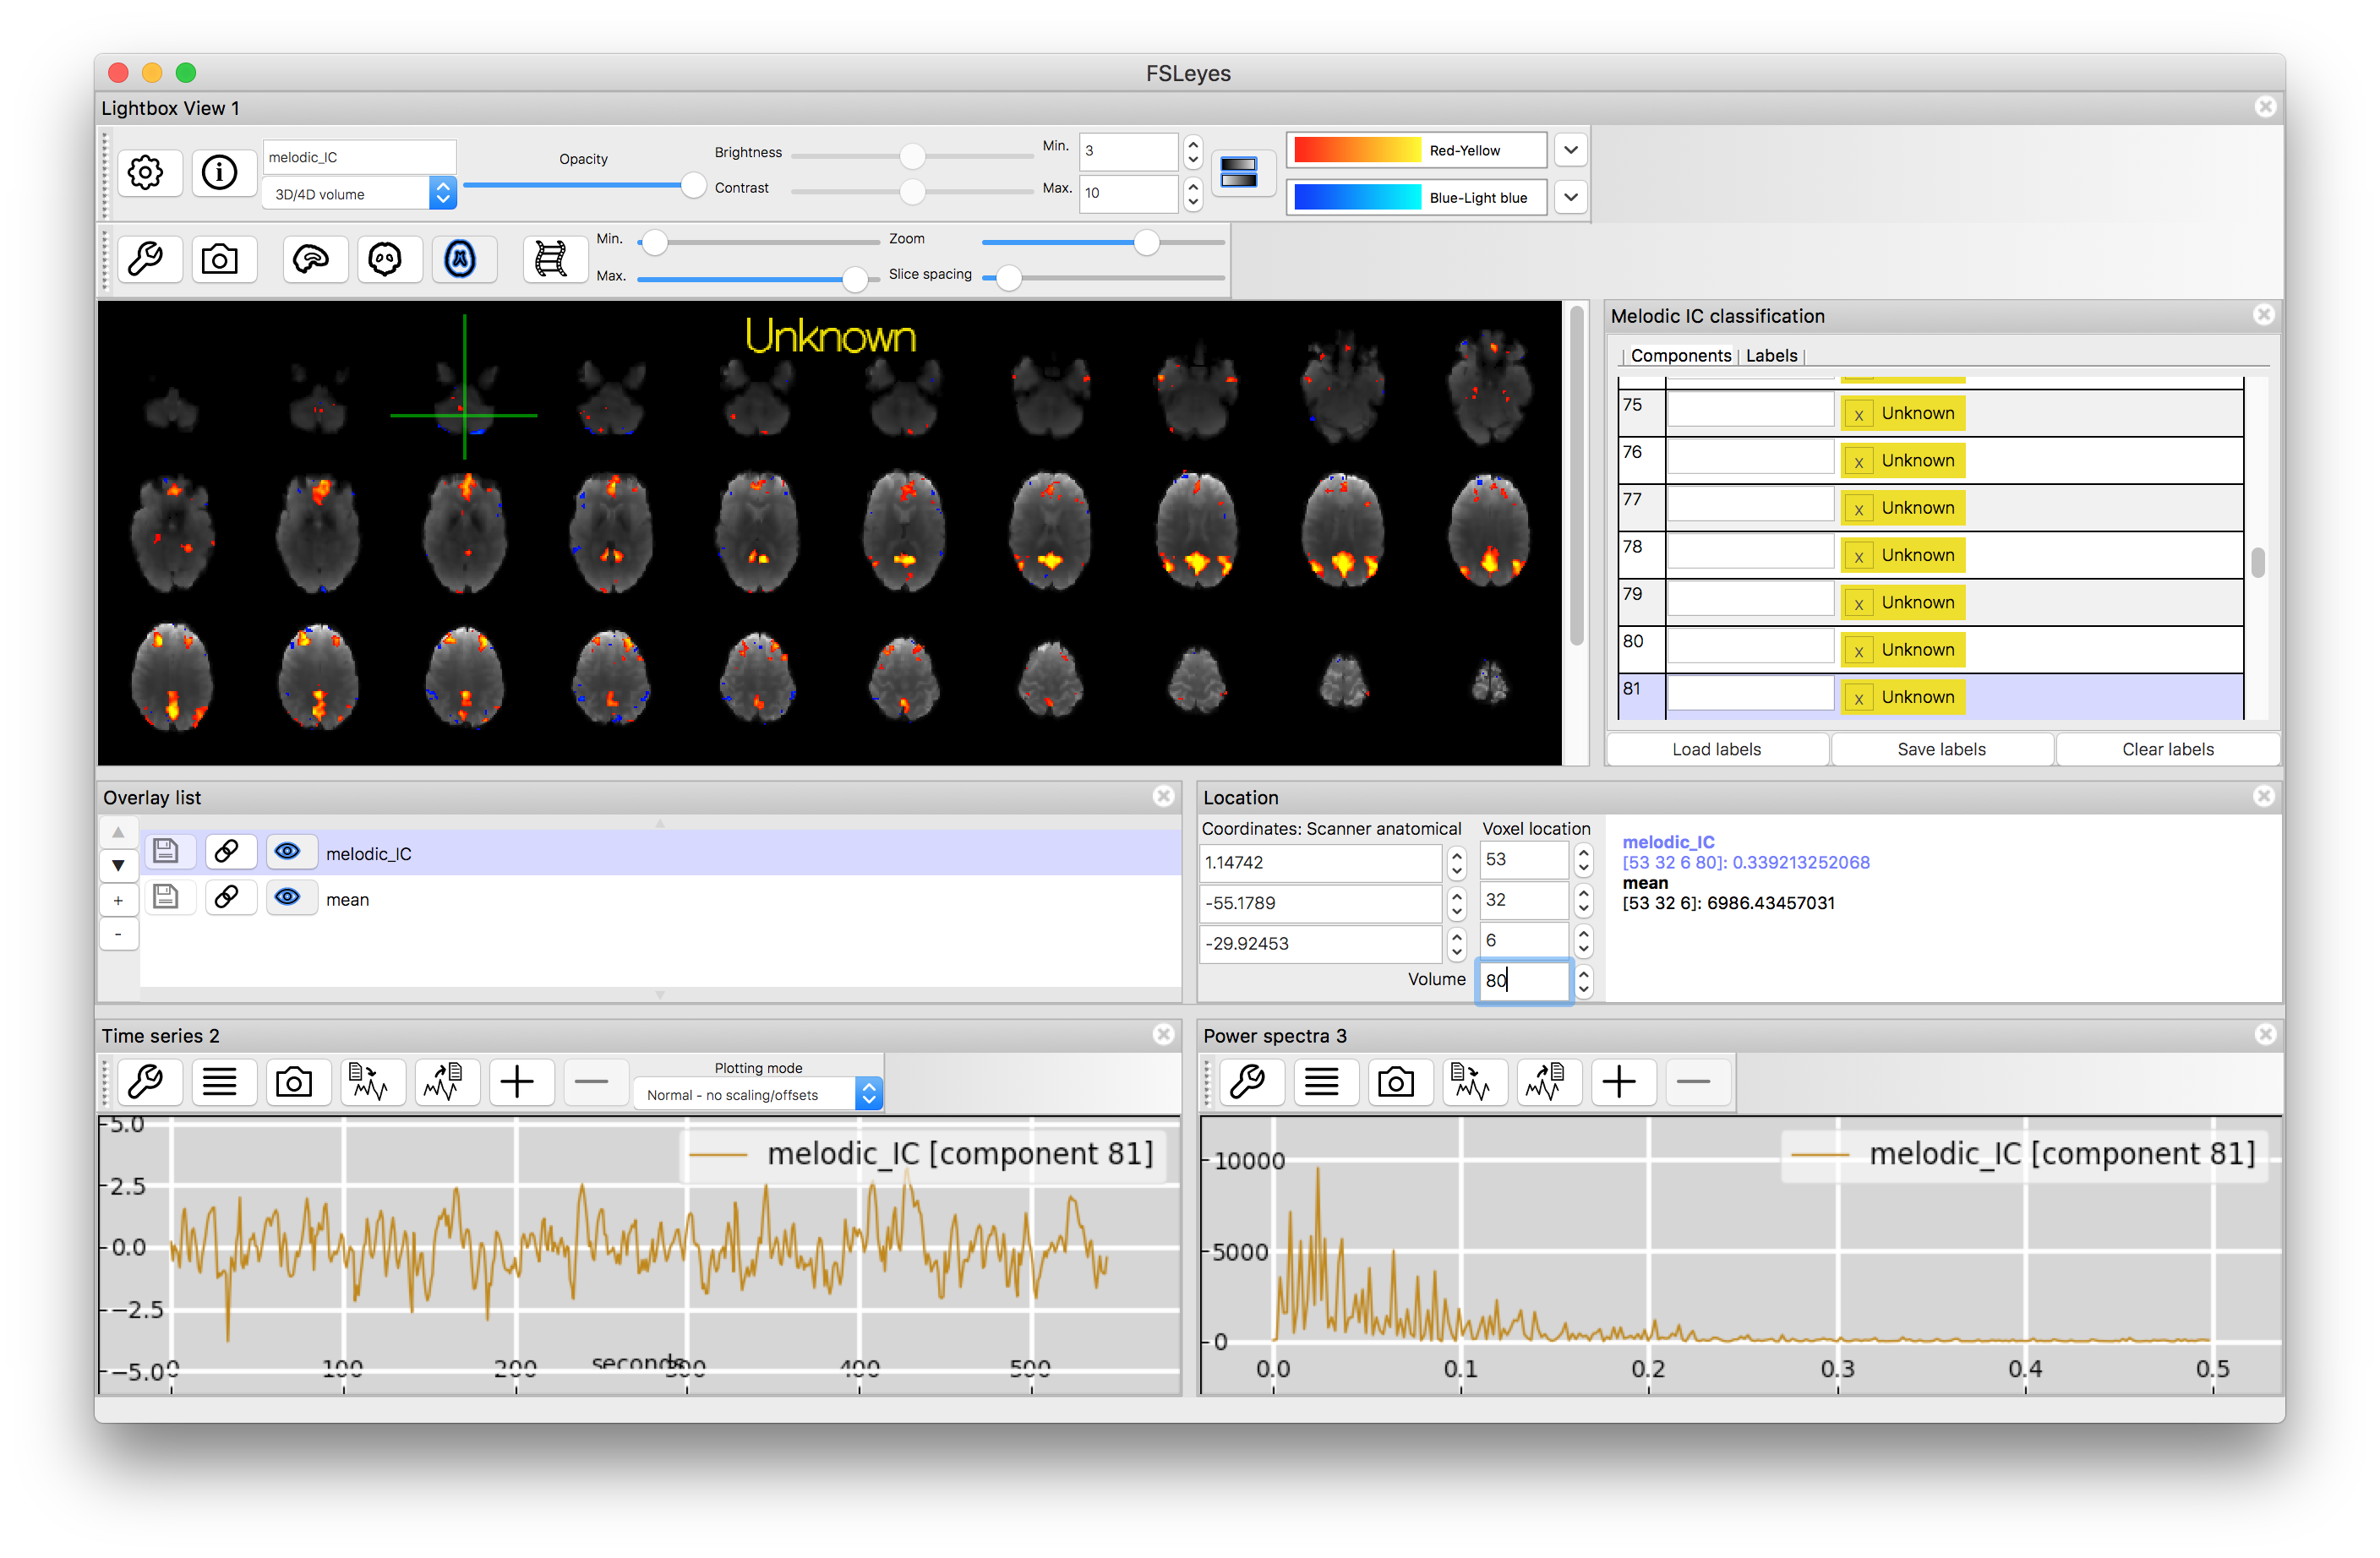
Resting State Network
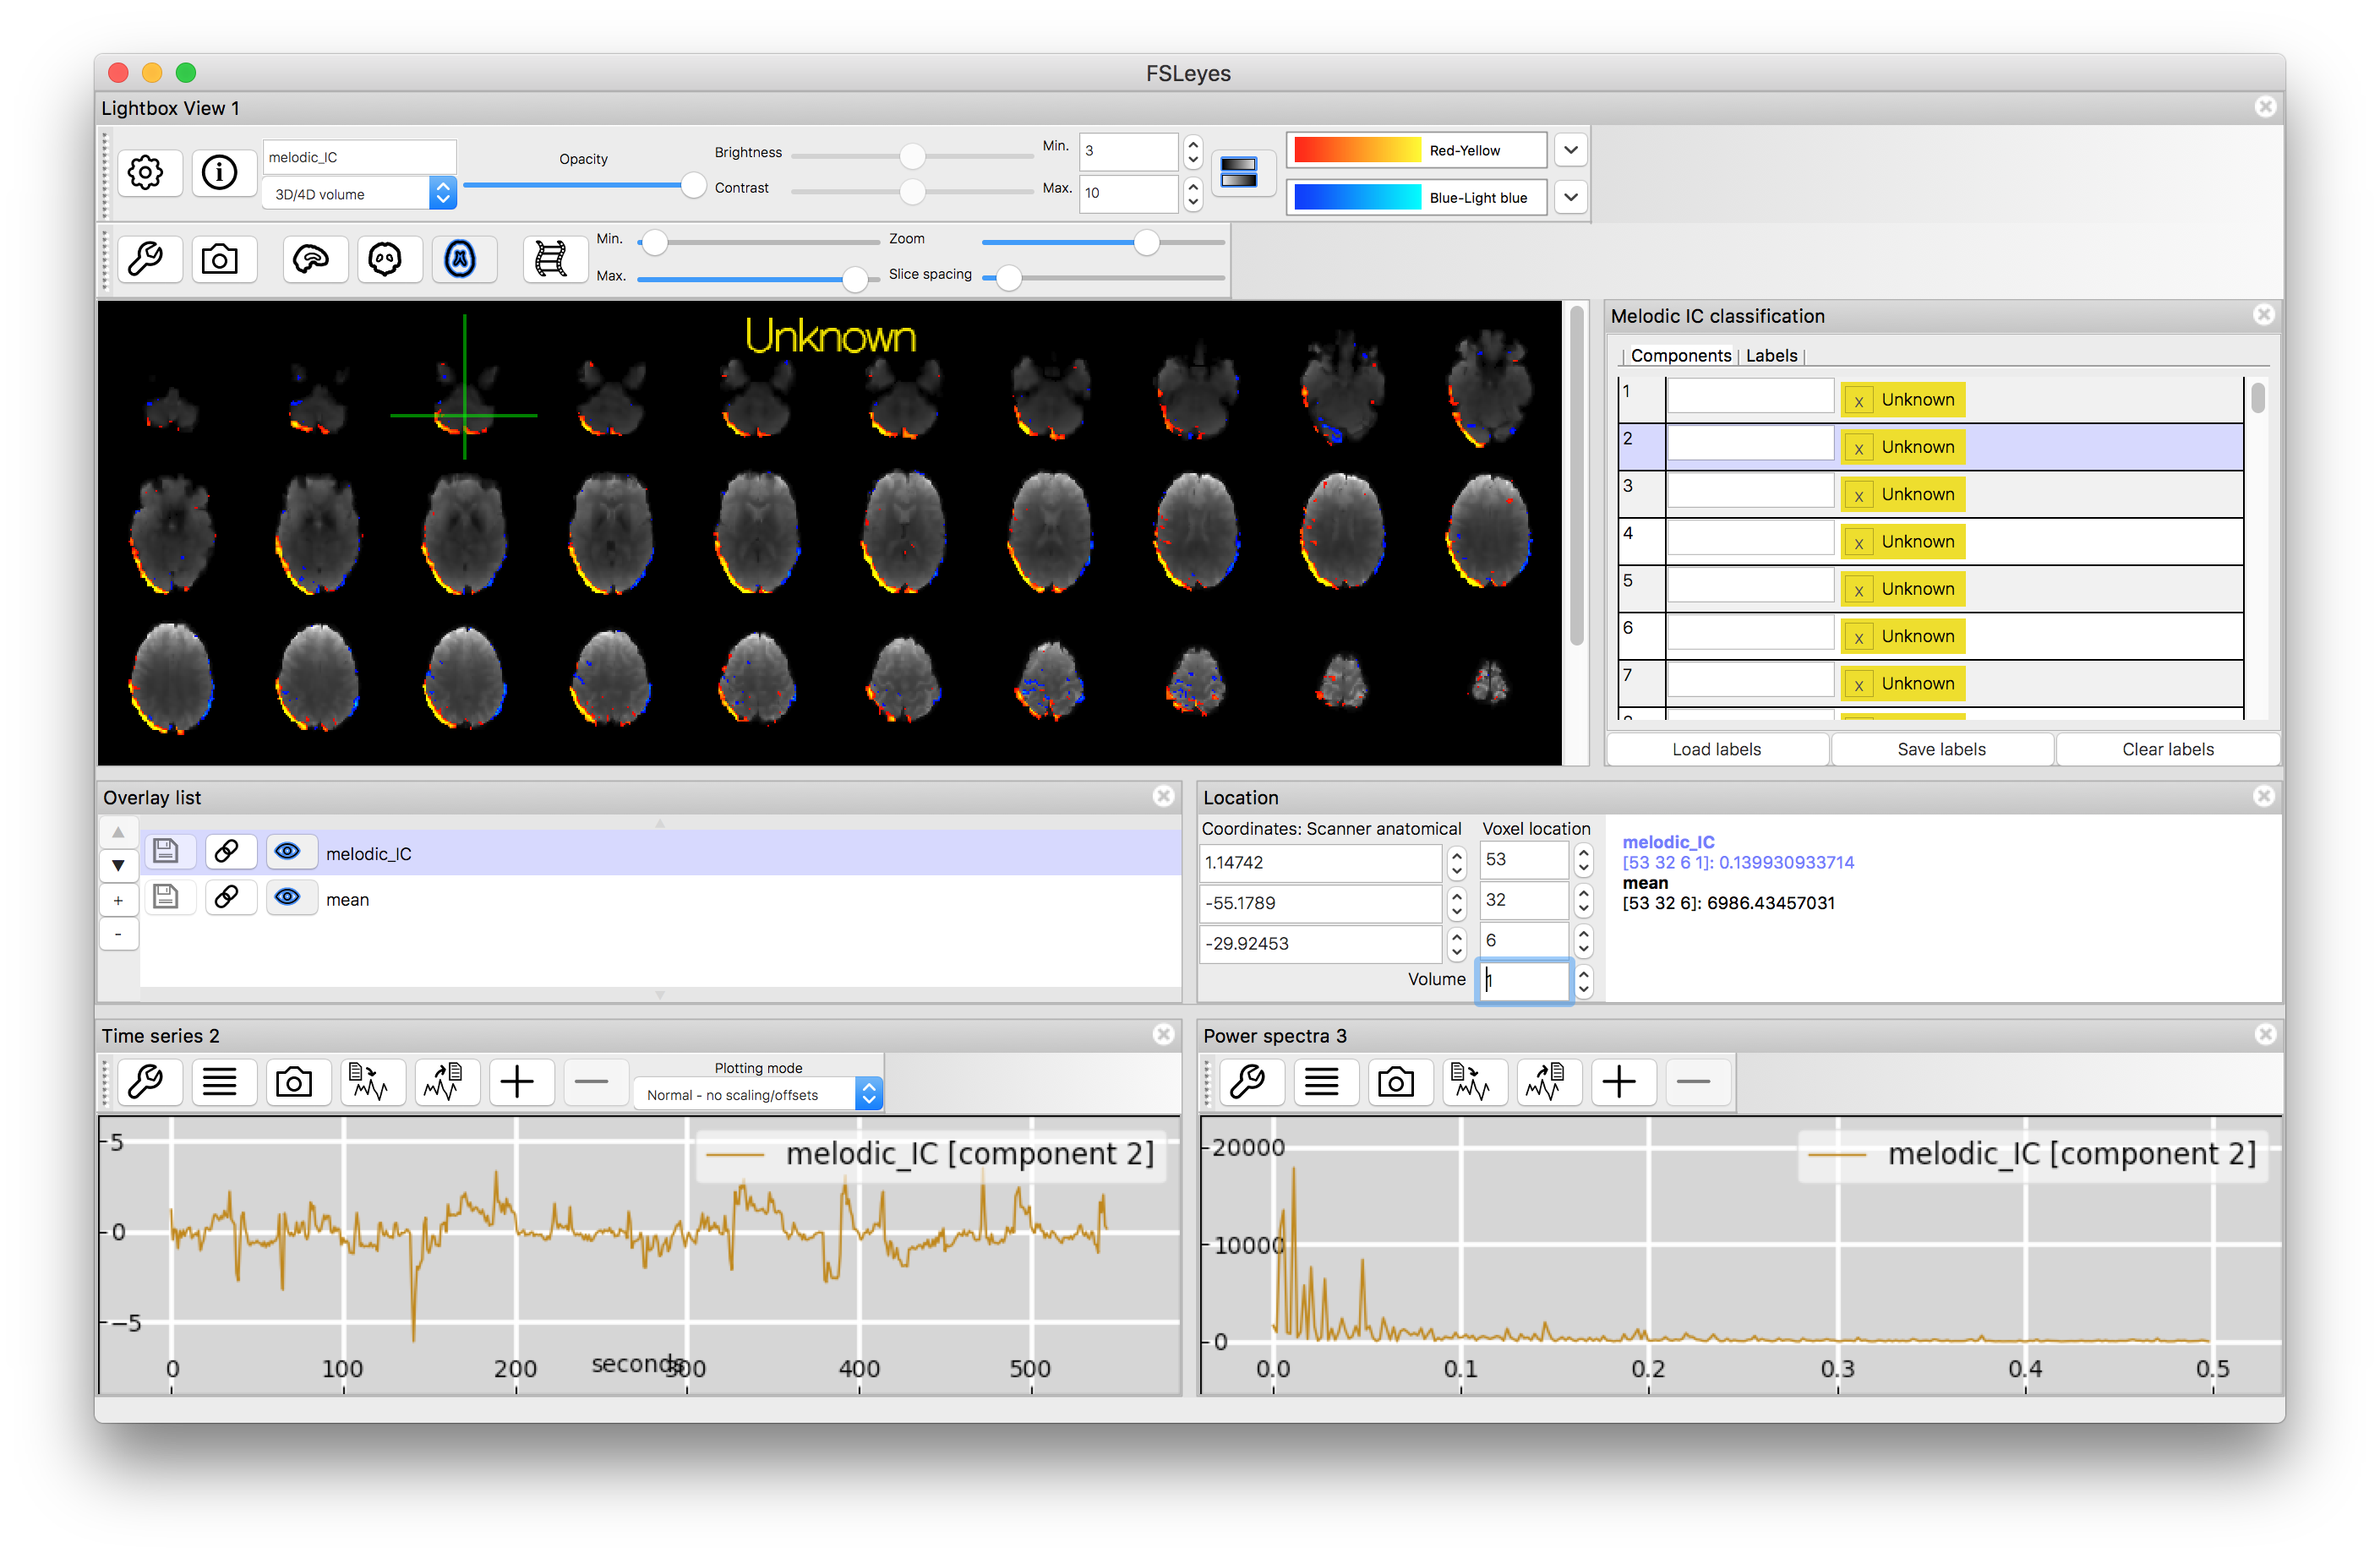
Motion Artifact
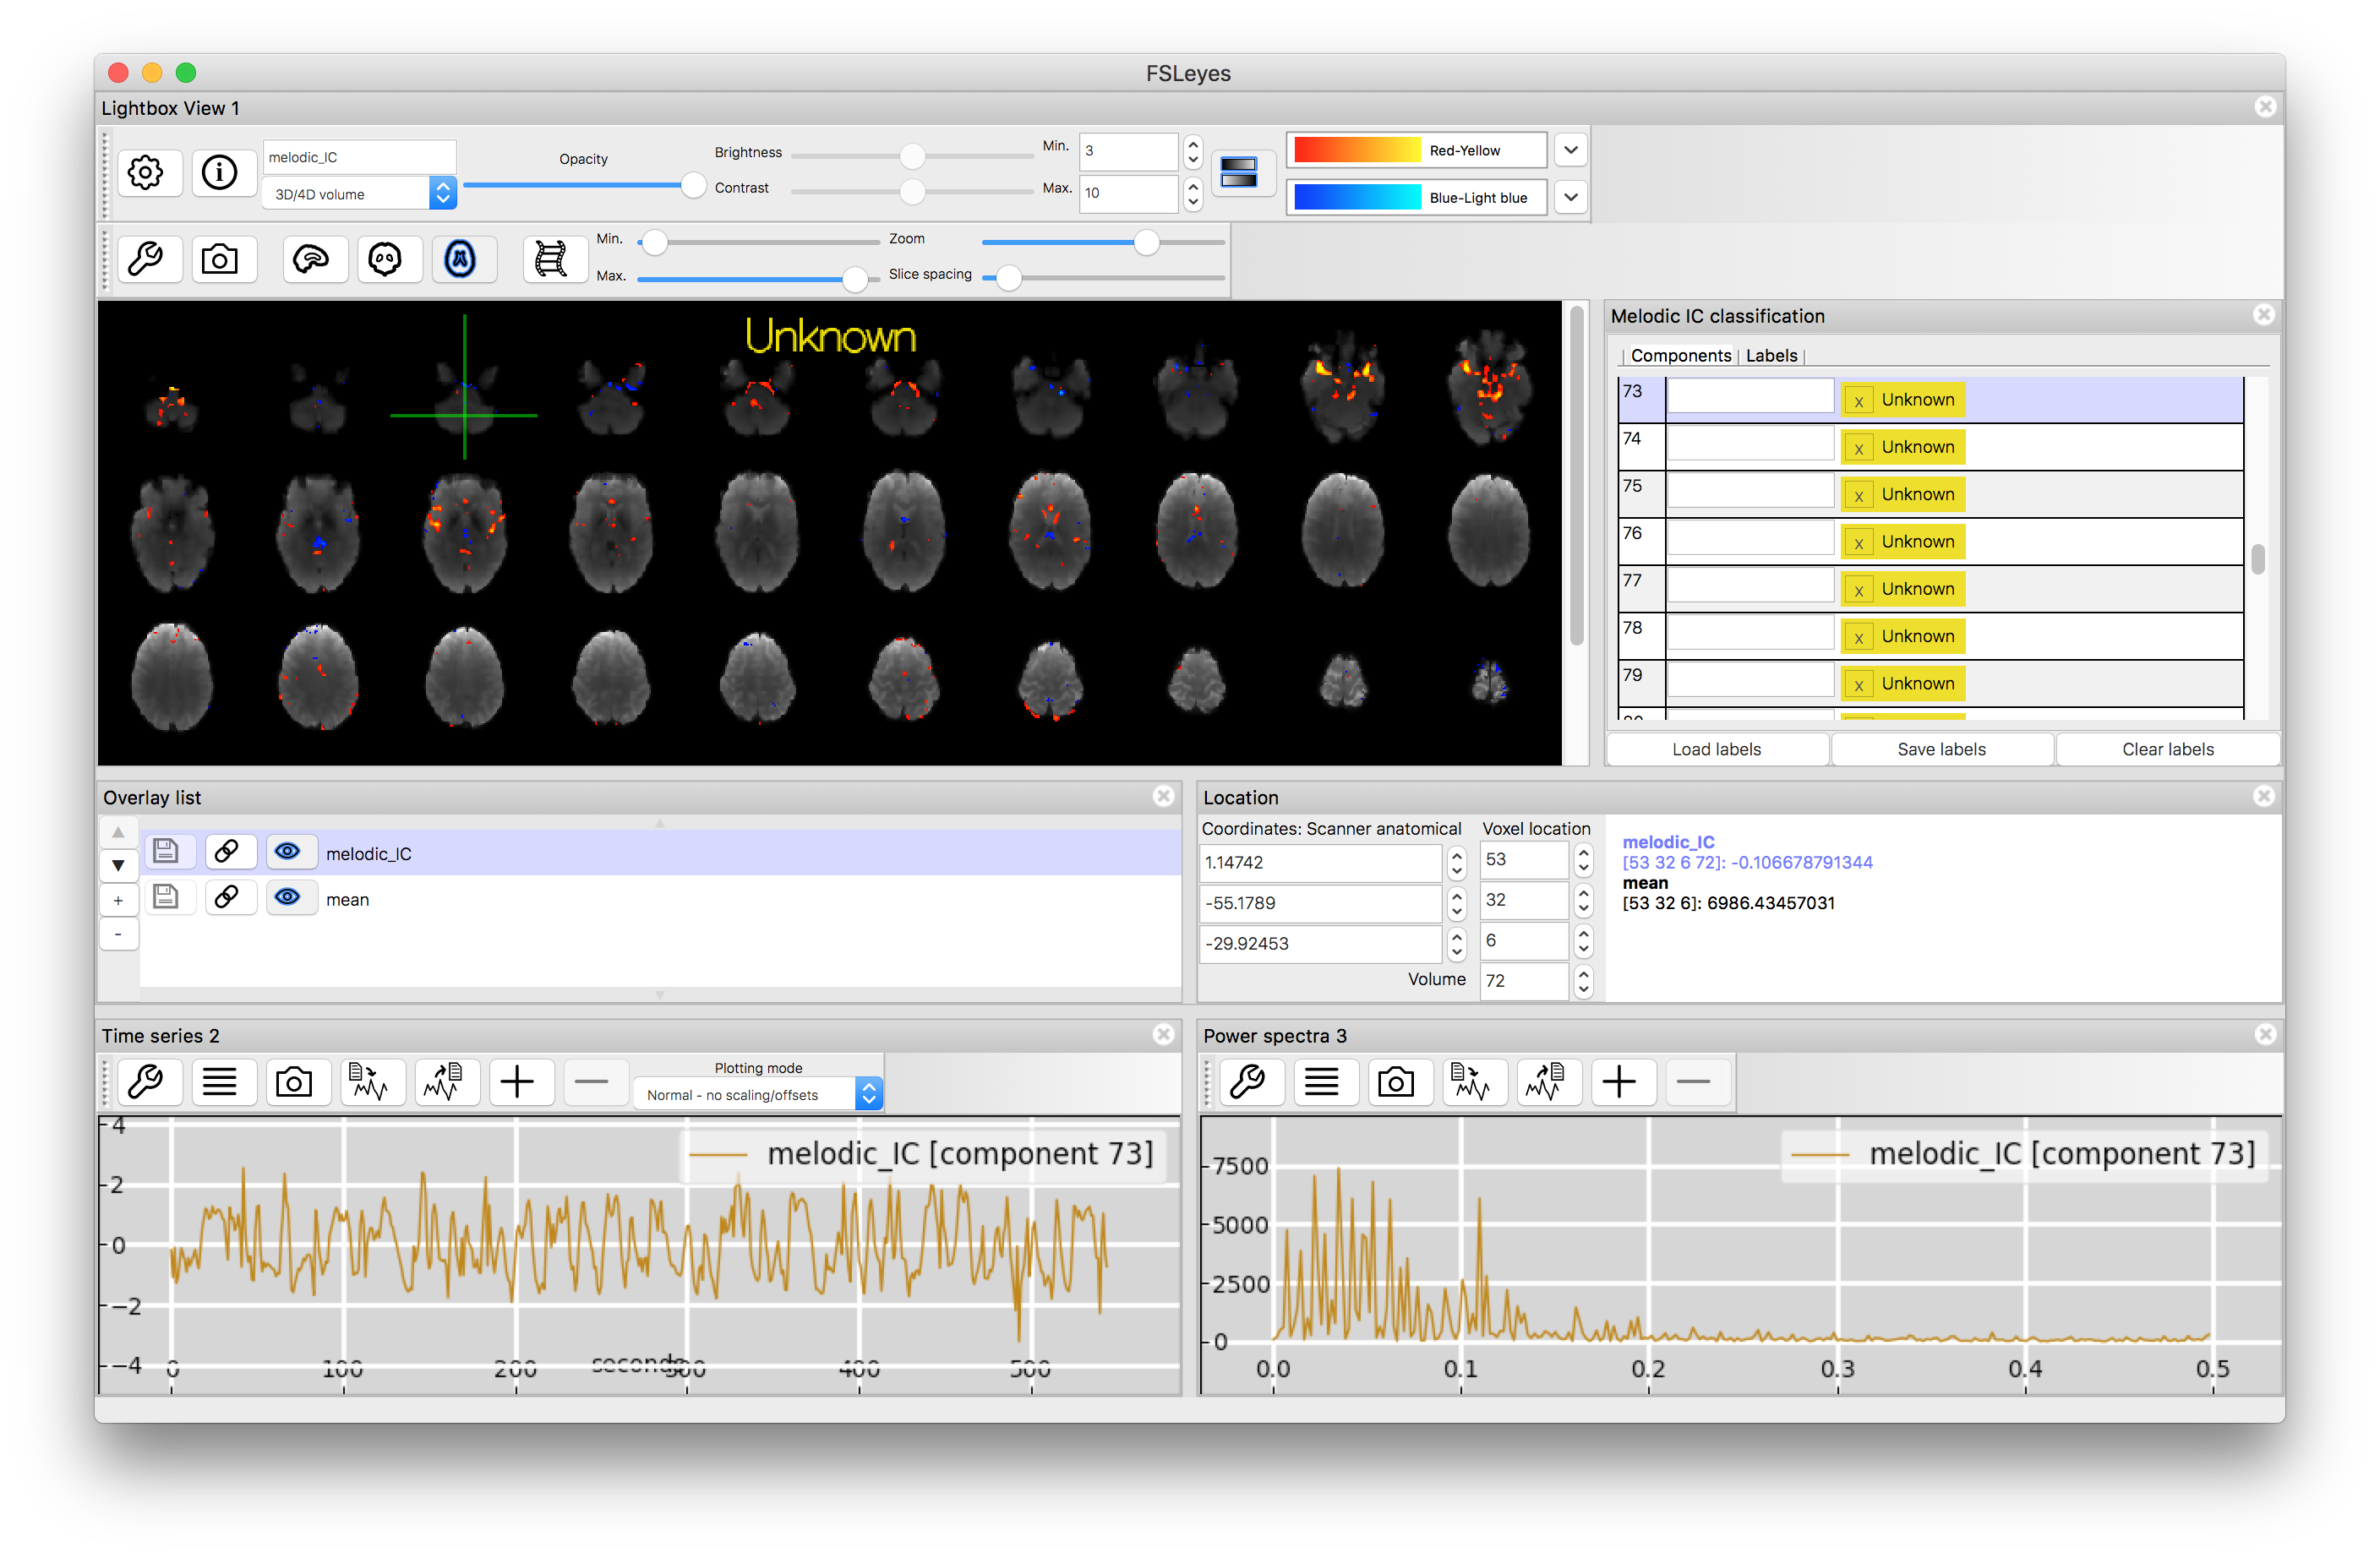
Cardiac Artifact
This example should give you some more experience at looking at ICA results for resting state data. Note that many components are difficult or even impossible to clearly identify, whereas others are quite straightforward. Experience identifying components and being familiar with the limitations of ICA will help in doing analysis of such data and also in being able to better interpret the literature.