Example Box: Learning anatomy with digital atlases
Introduction
The aim of this example is to become familiar with what information is available in digital atlases and know how to interact with them in order to use them as a tool in research or for studying anatomy.
This example is based on tools available in FSL, but similar atlases and viewing tools are available in other neuroimaging software packages.
Viewing the Atlases
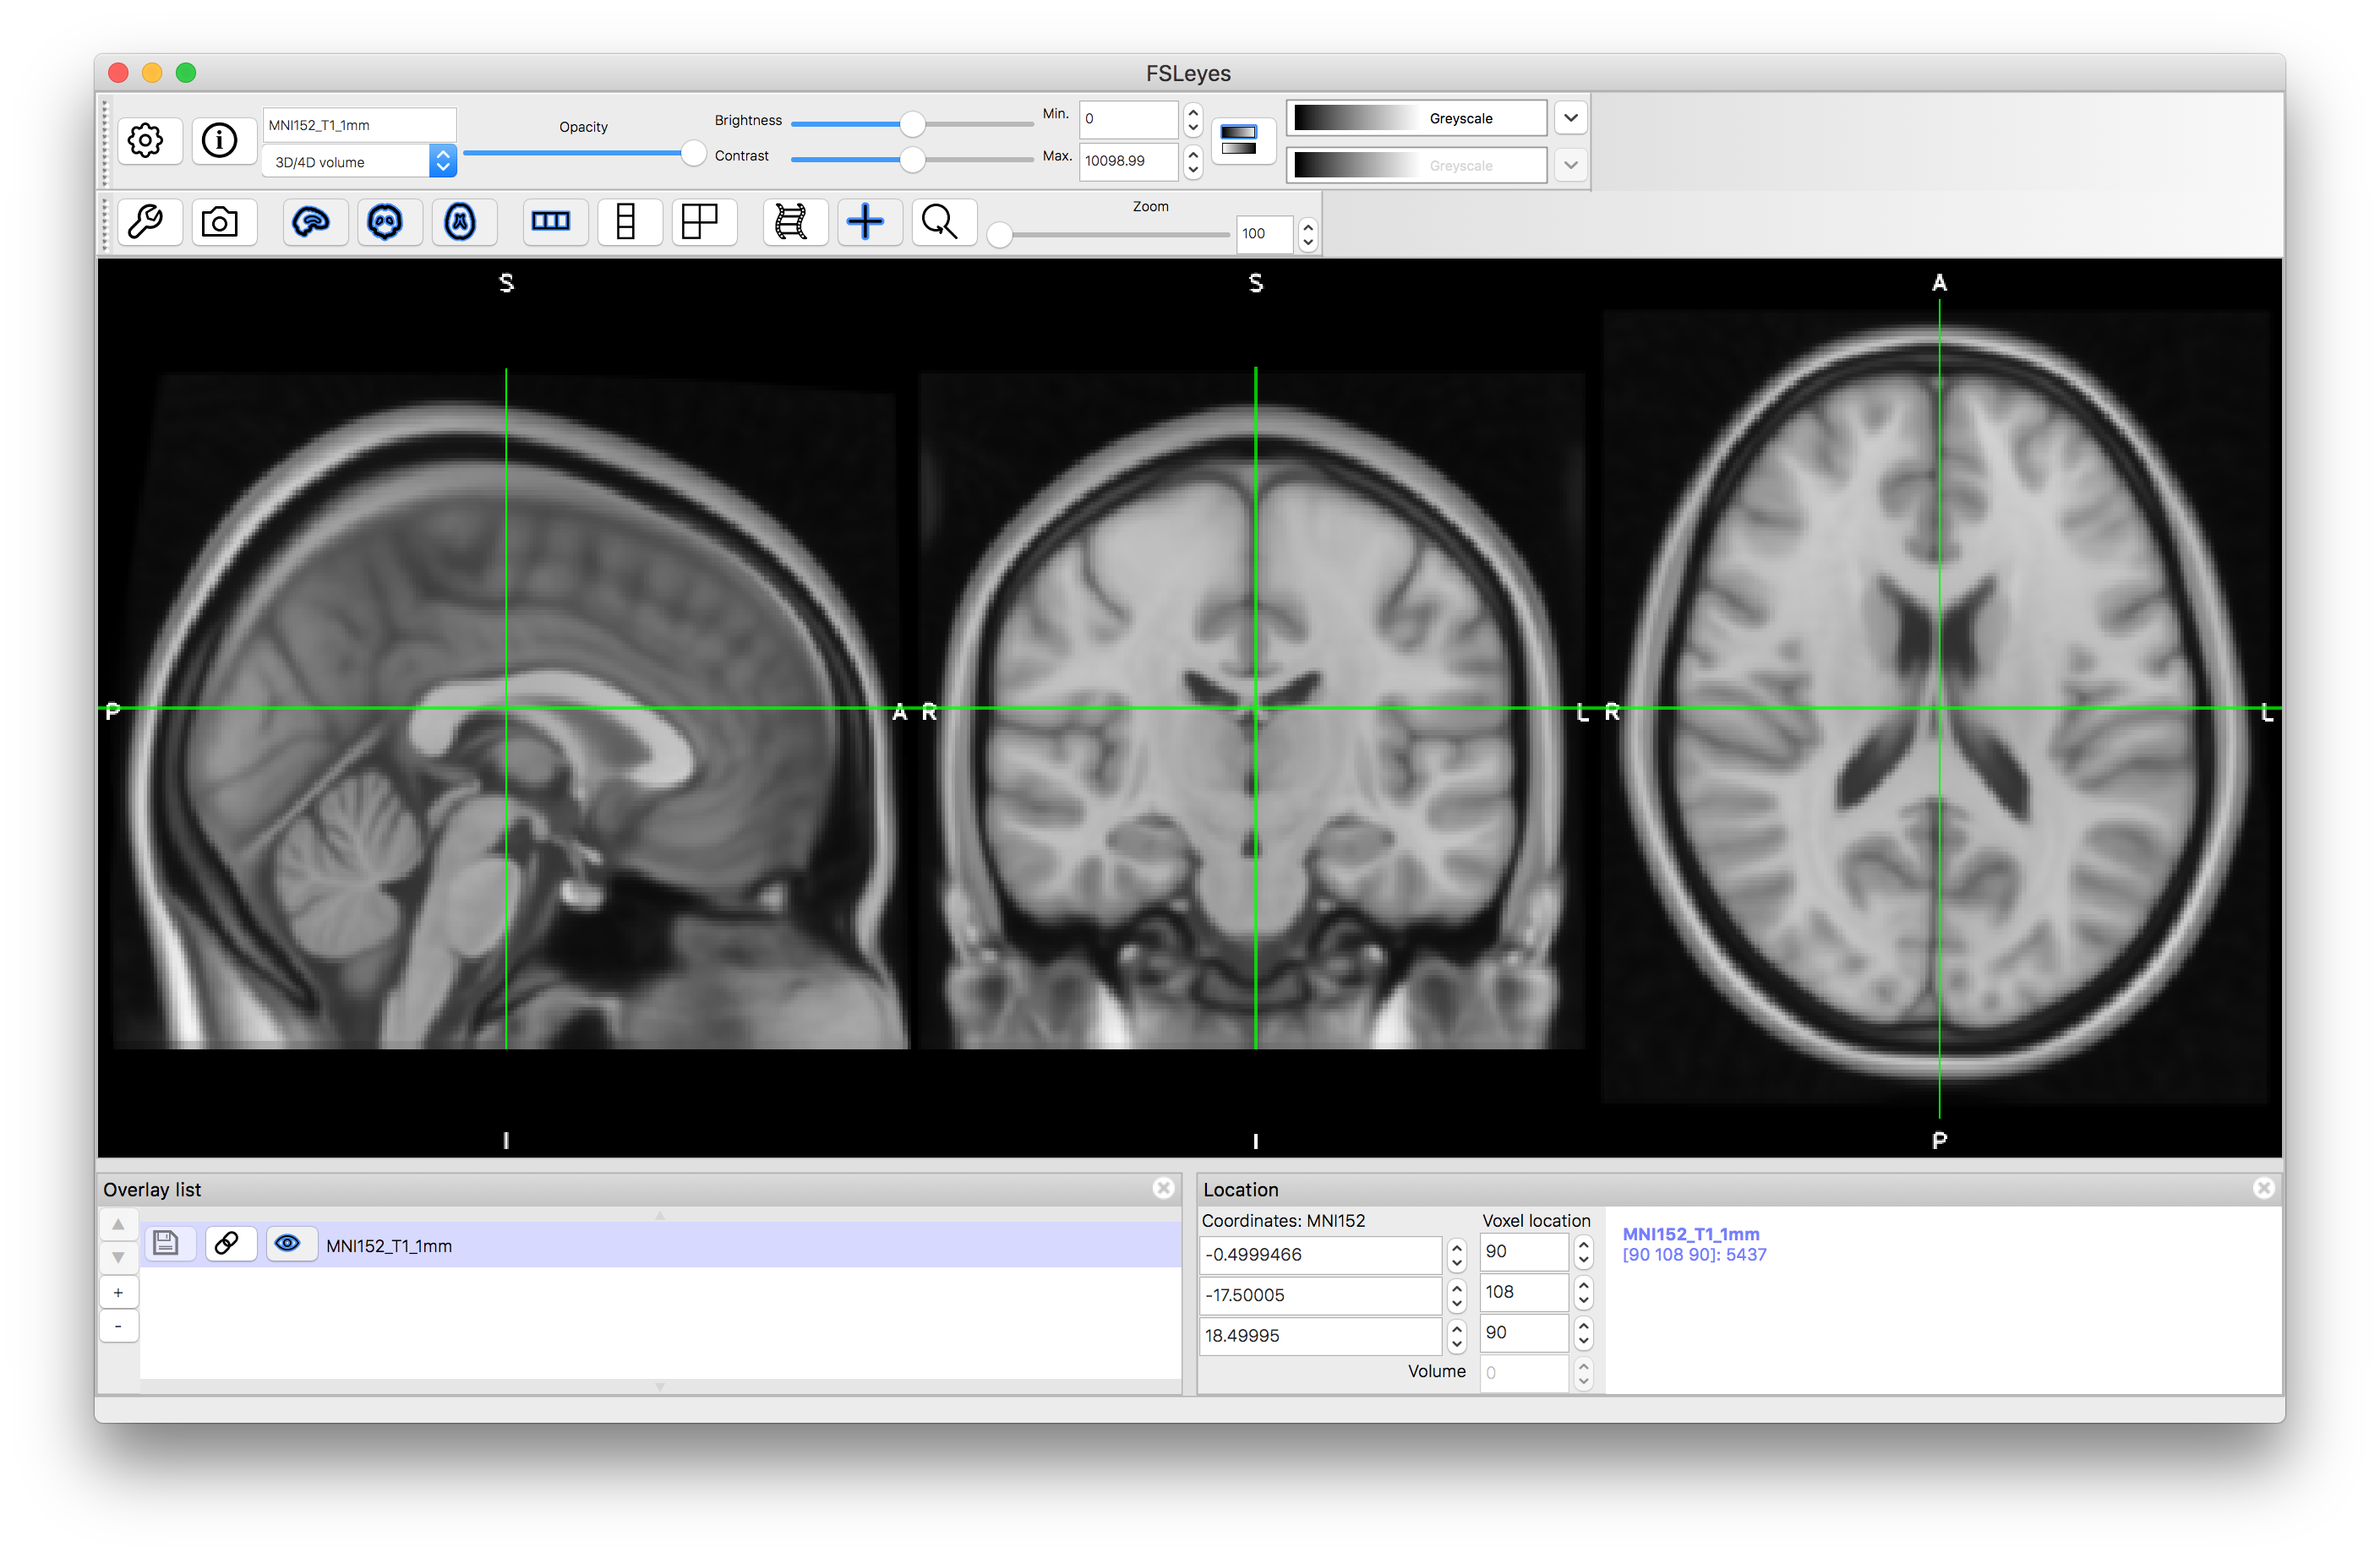
Start by opening a viewer (e.g. fsleyes) and load in the MNI152_T1_1mm template image (e.g. by using Add standard in the File menu).
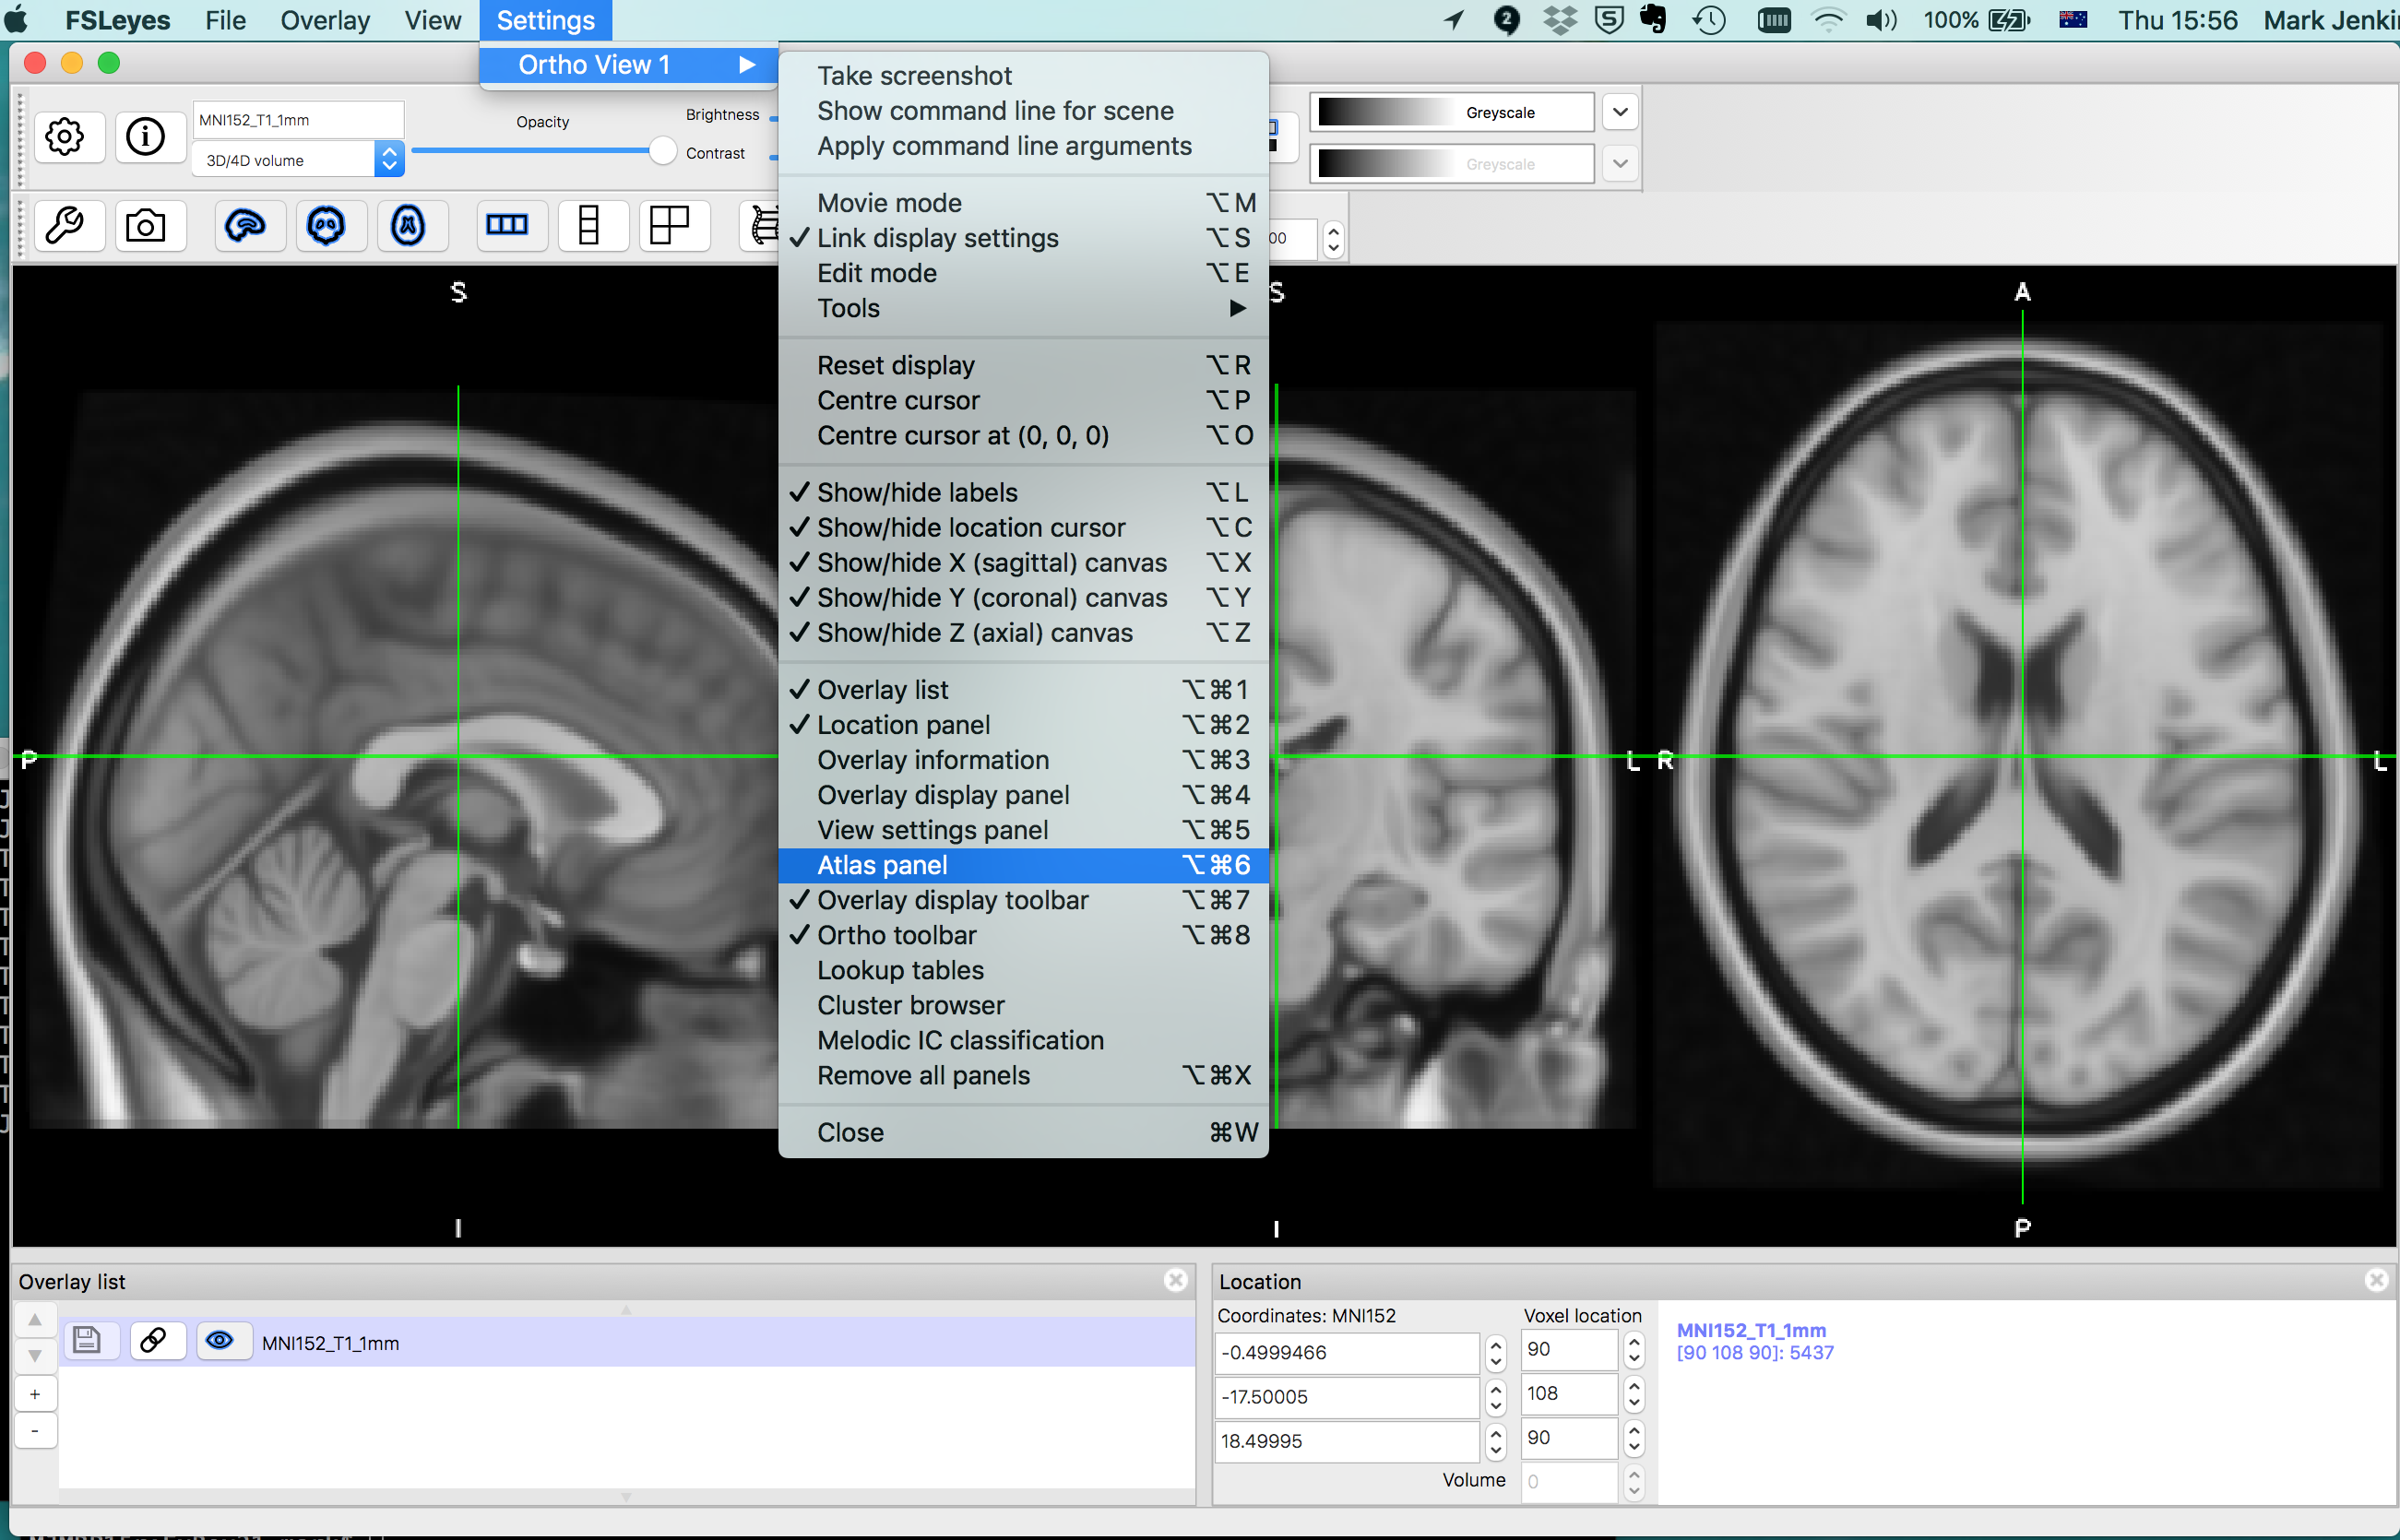
Now turn on the atlas panel via the menus: Settings --> Ortho View 1 --> Atlas panel. This will open a panel in the lower part of the fsleyes window that shows information relating to the atlases. You might want to make these panels larger (by dragging the dividing bar between them and the image upward).
Harvard-Oxford Atlases
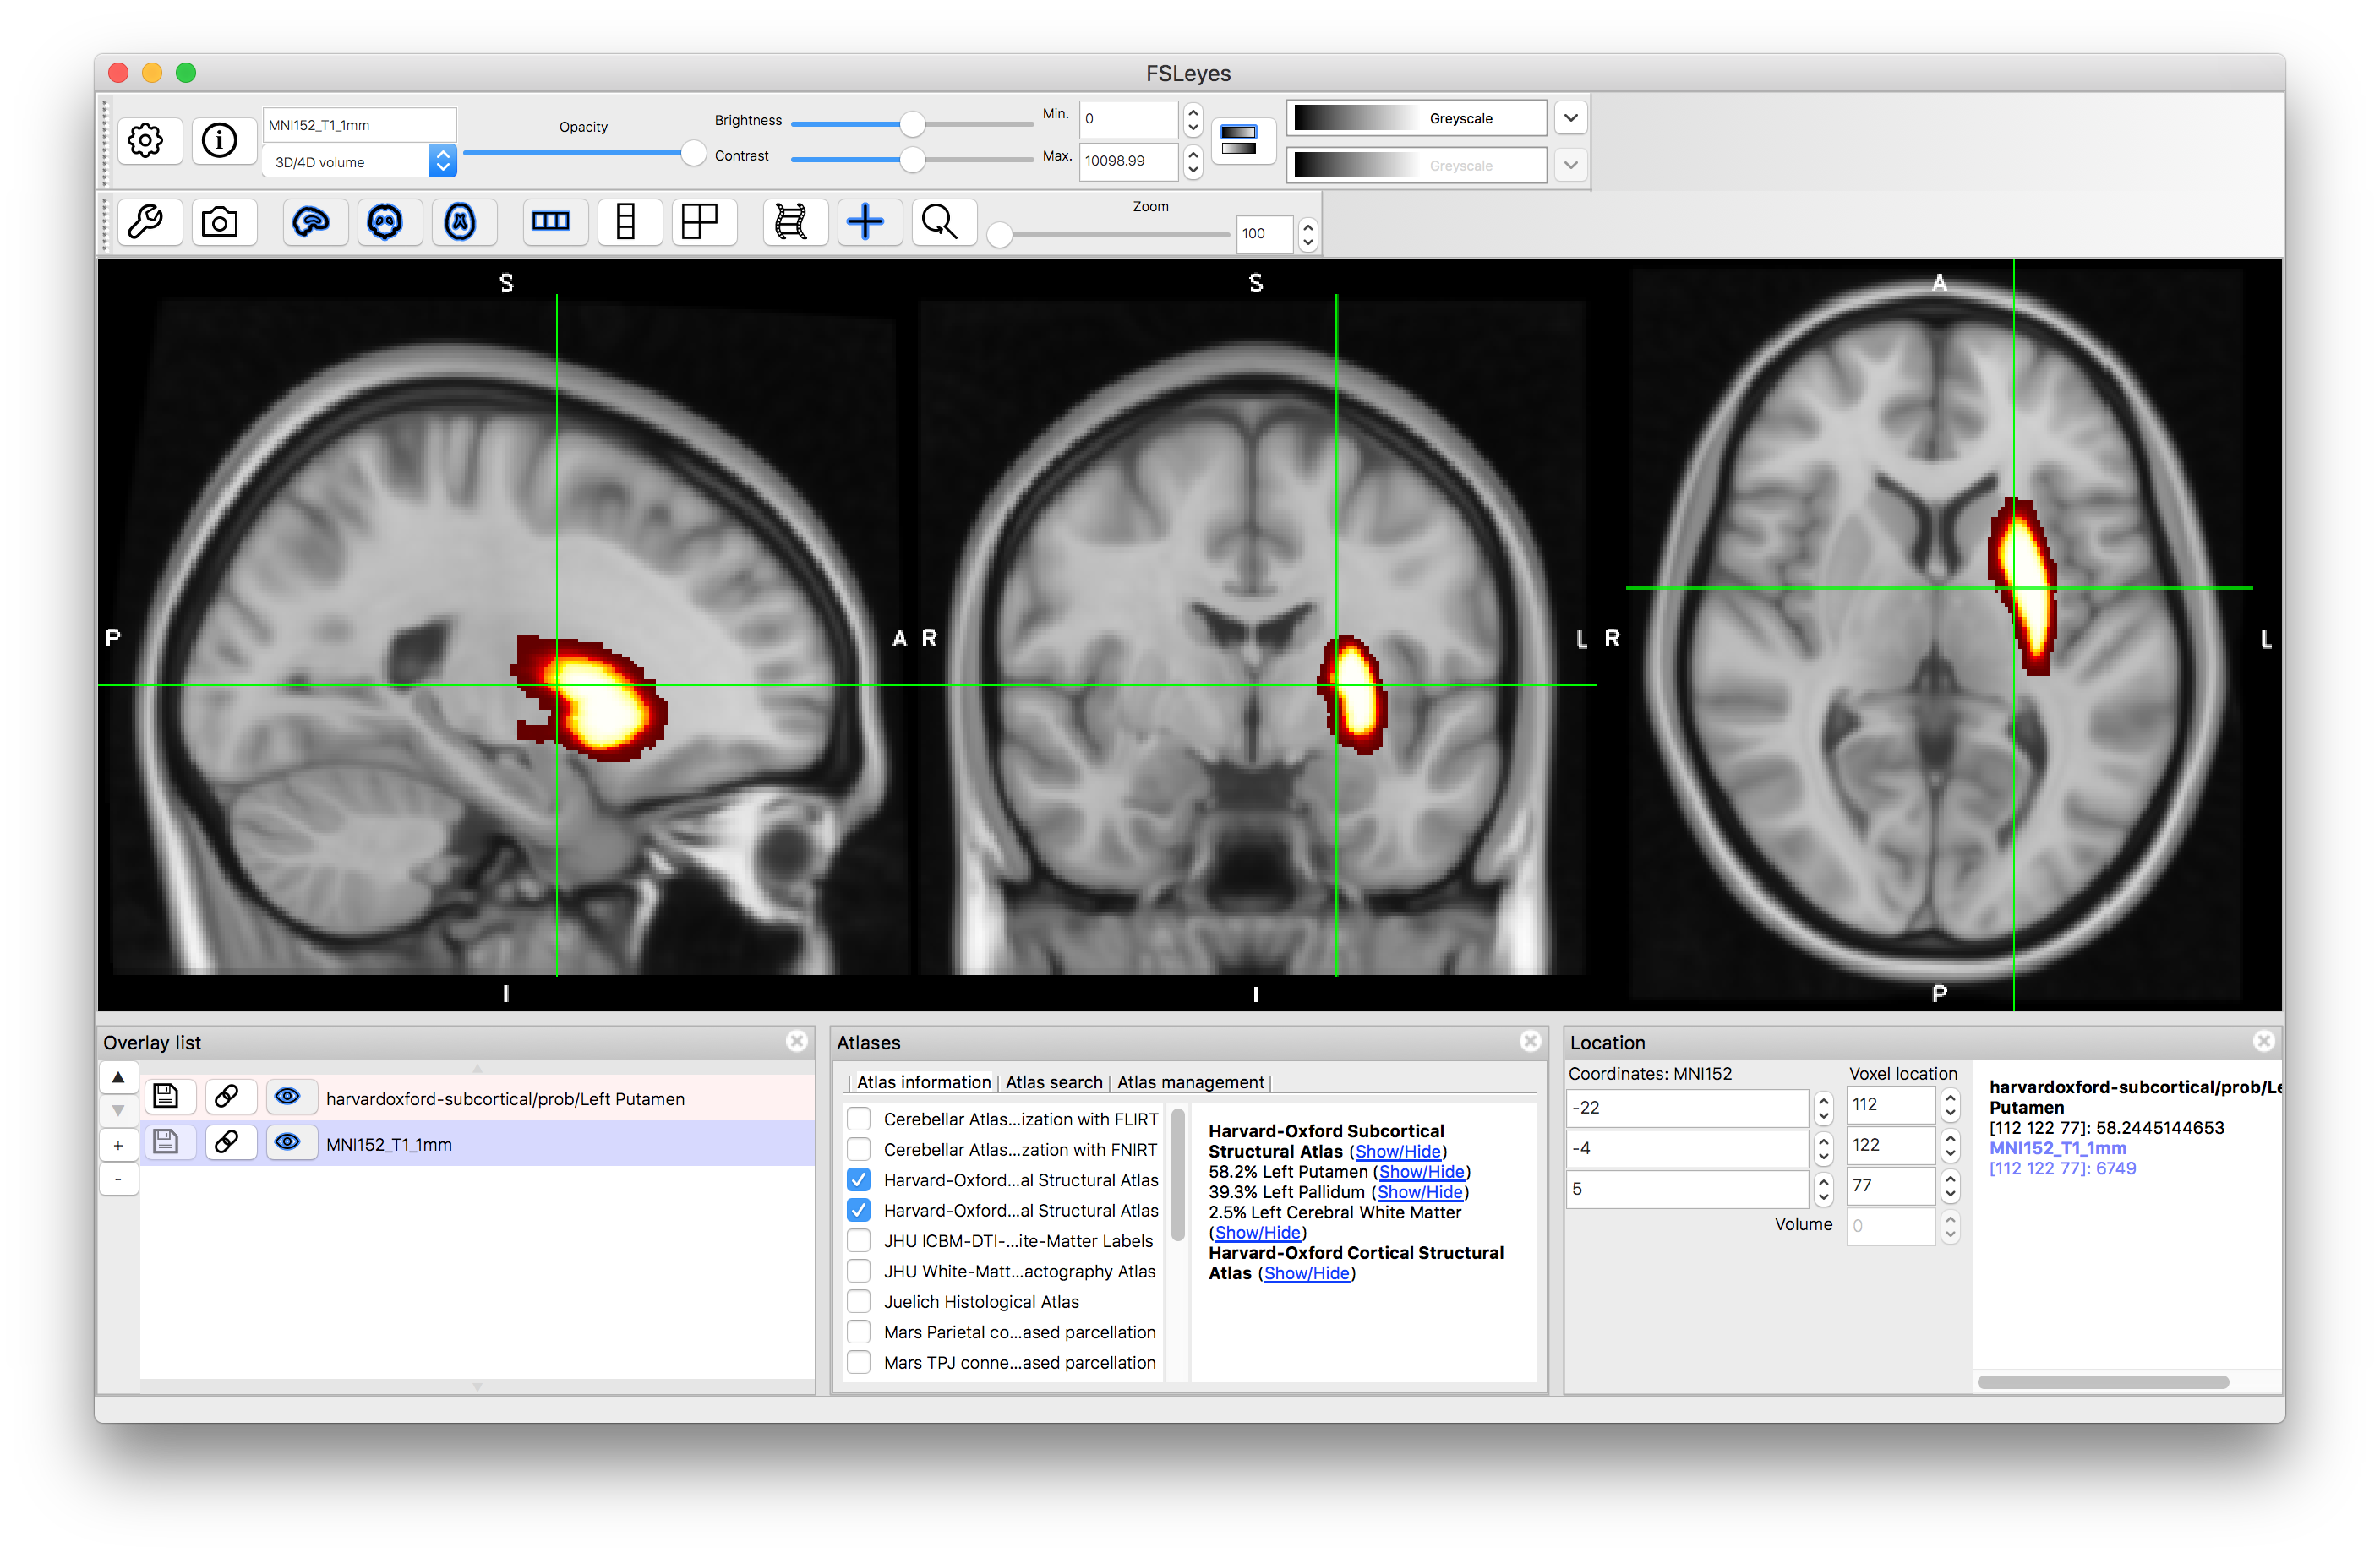
By default this will open both the Harvard-Oxford cortical and subcortical atlases.
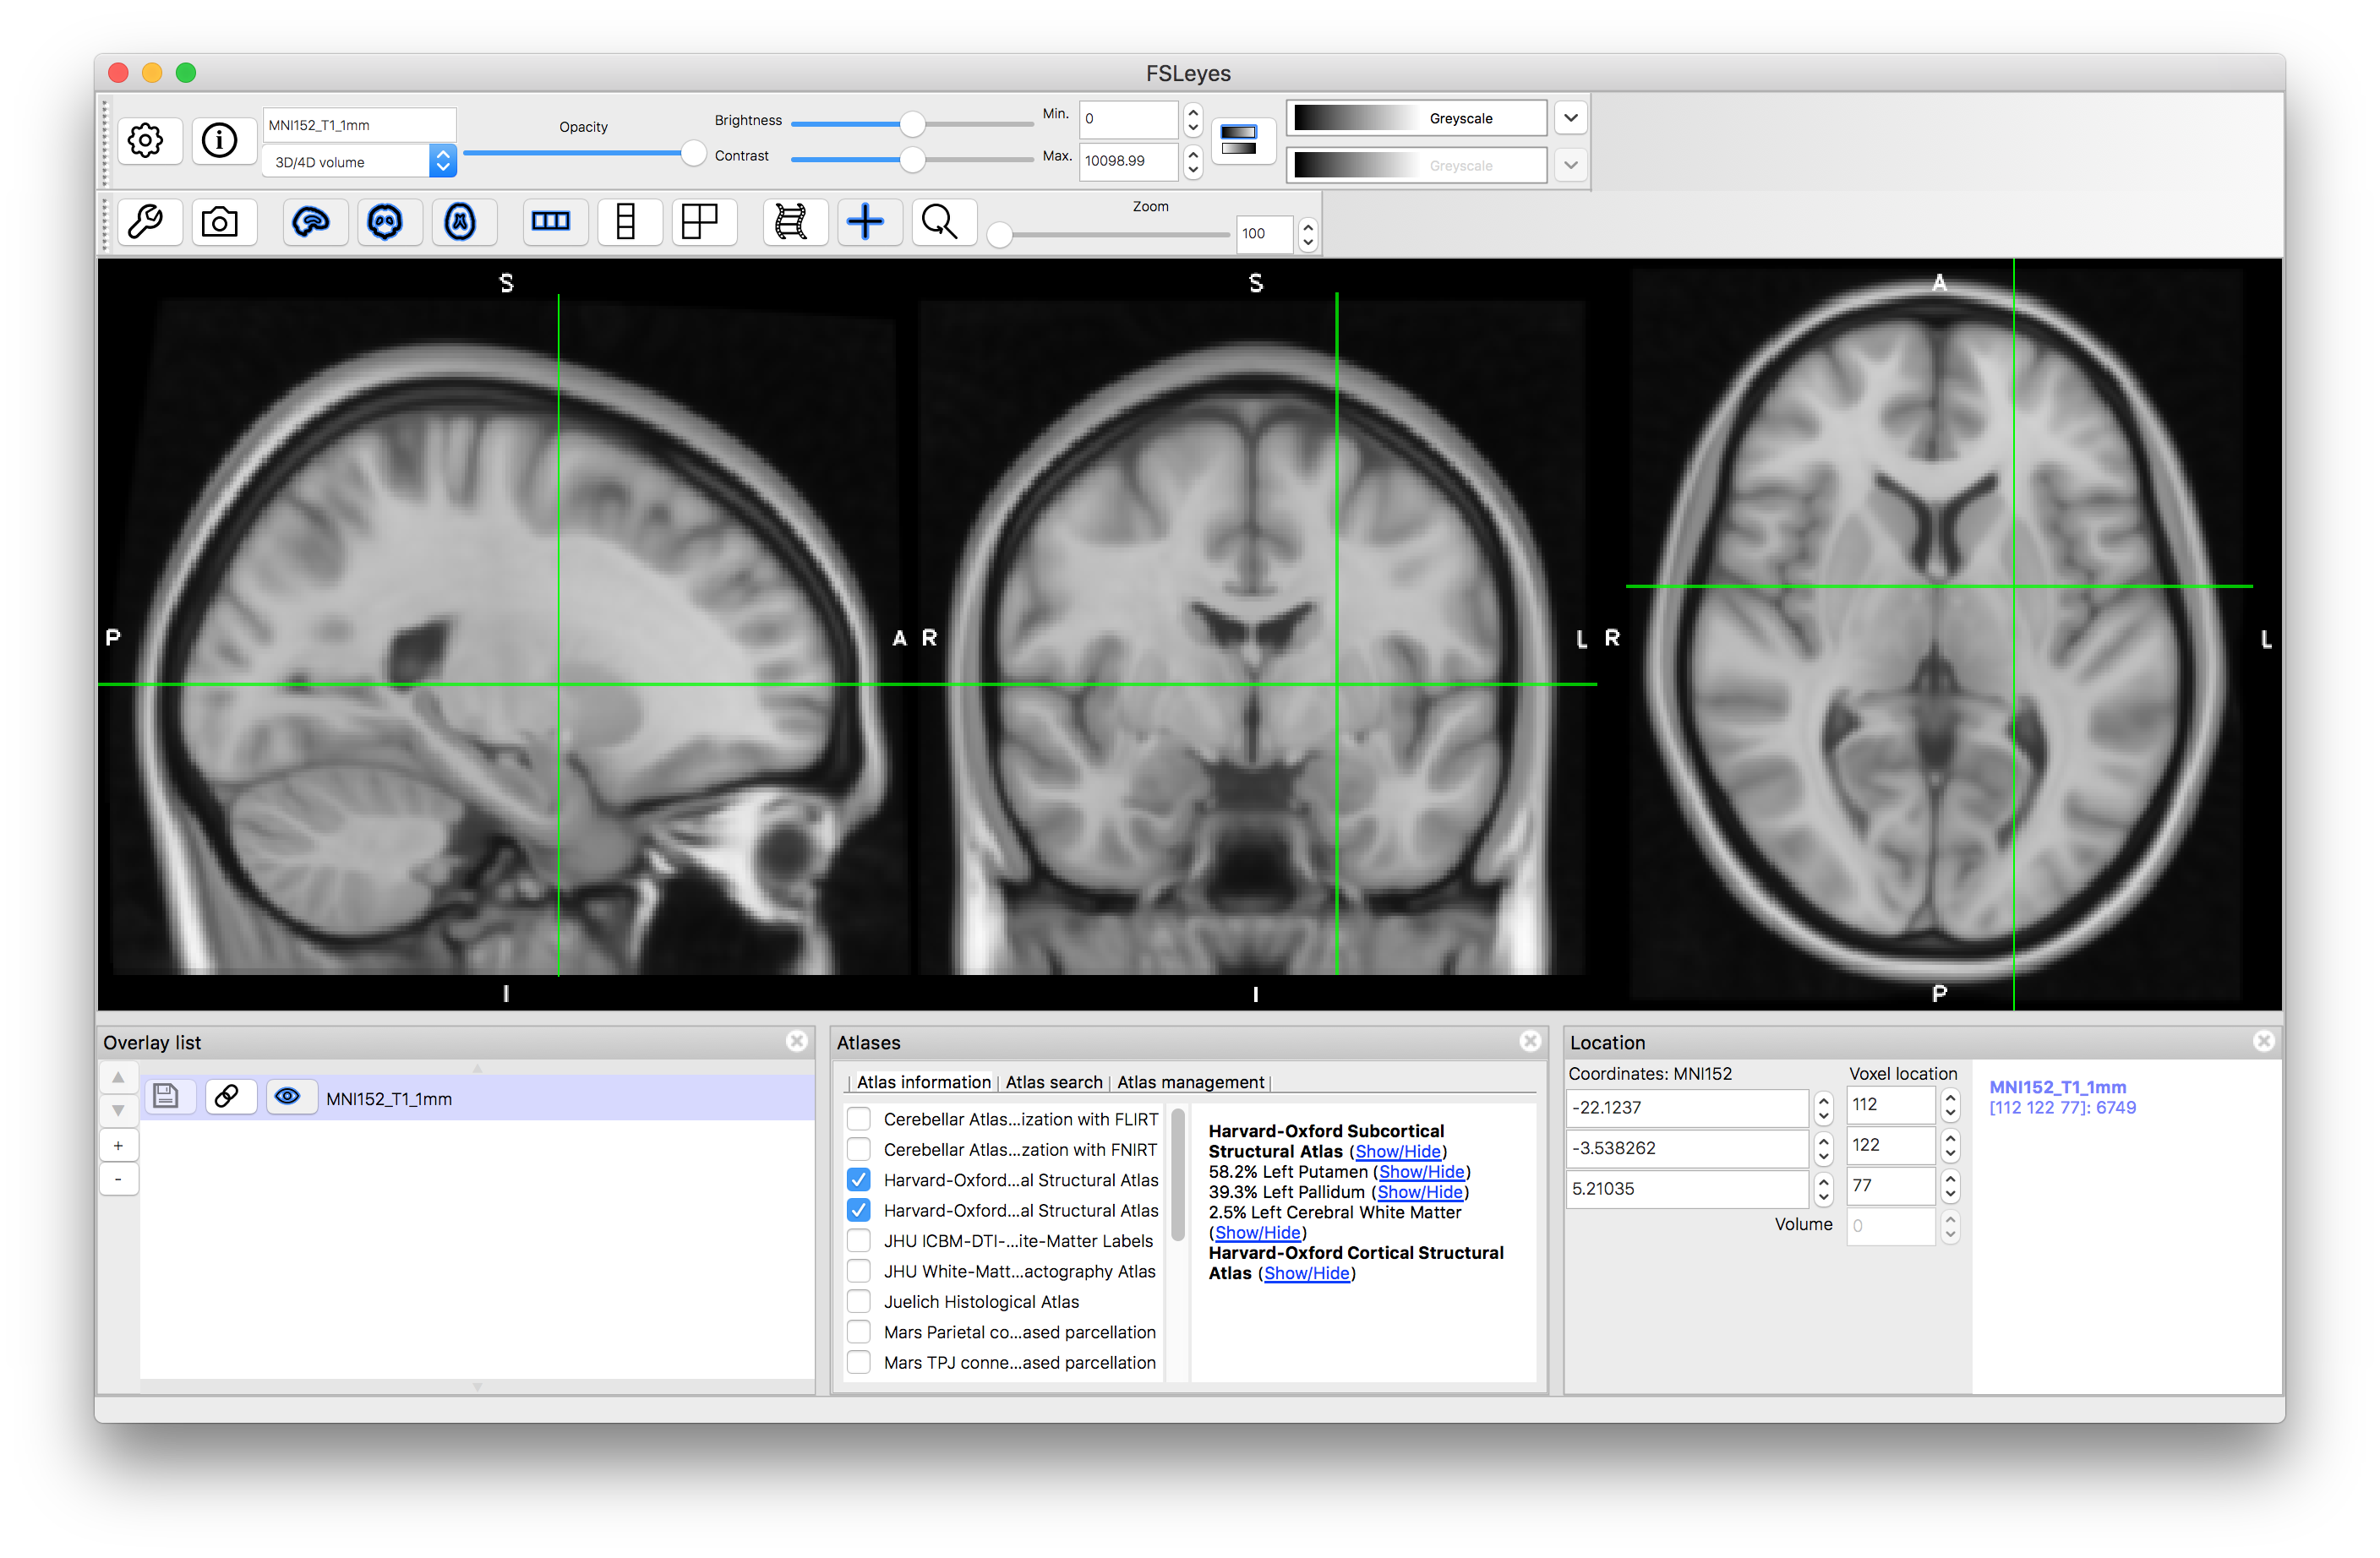
As you click around the image you will see information about the probability of the current location being in different structures (e.g. in the image above the location is on the edge of the putamen and pallidum, which is reflected by the probabilities displayed: 58.2% for Left Putamen, 39.3% for Left Pallidum and 2.5% for Left Cerebral White Matter. These all come from the Subcortical atlas, with no information provided by the Cortical atlas, but if you select a location in the cortex then this will change. This is useful to find out information about a specific location. Keep in mind that this is probabilistic information (obtained from an average over a group of individuals) and displayed on an average template (derived from a different group of individuals) so it is not quite the same as determining the anatomy in a single subject, where the transitions would be sharper and only one structure would be associated with each location.
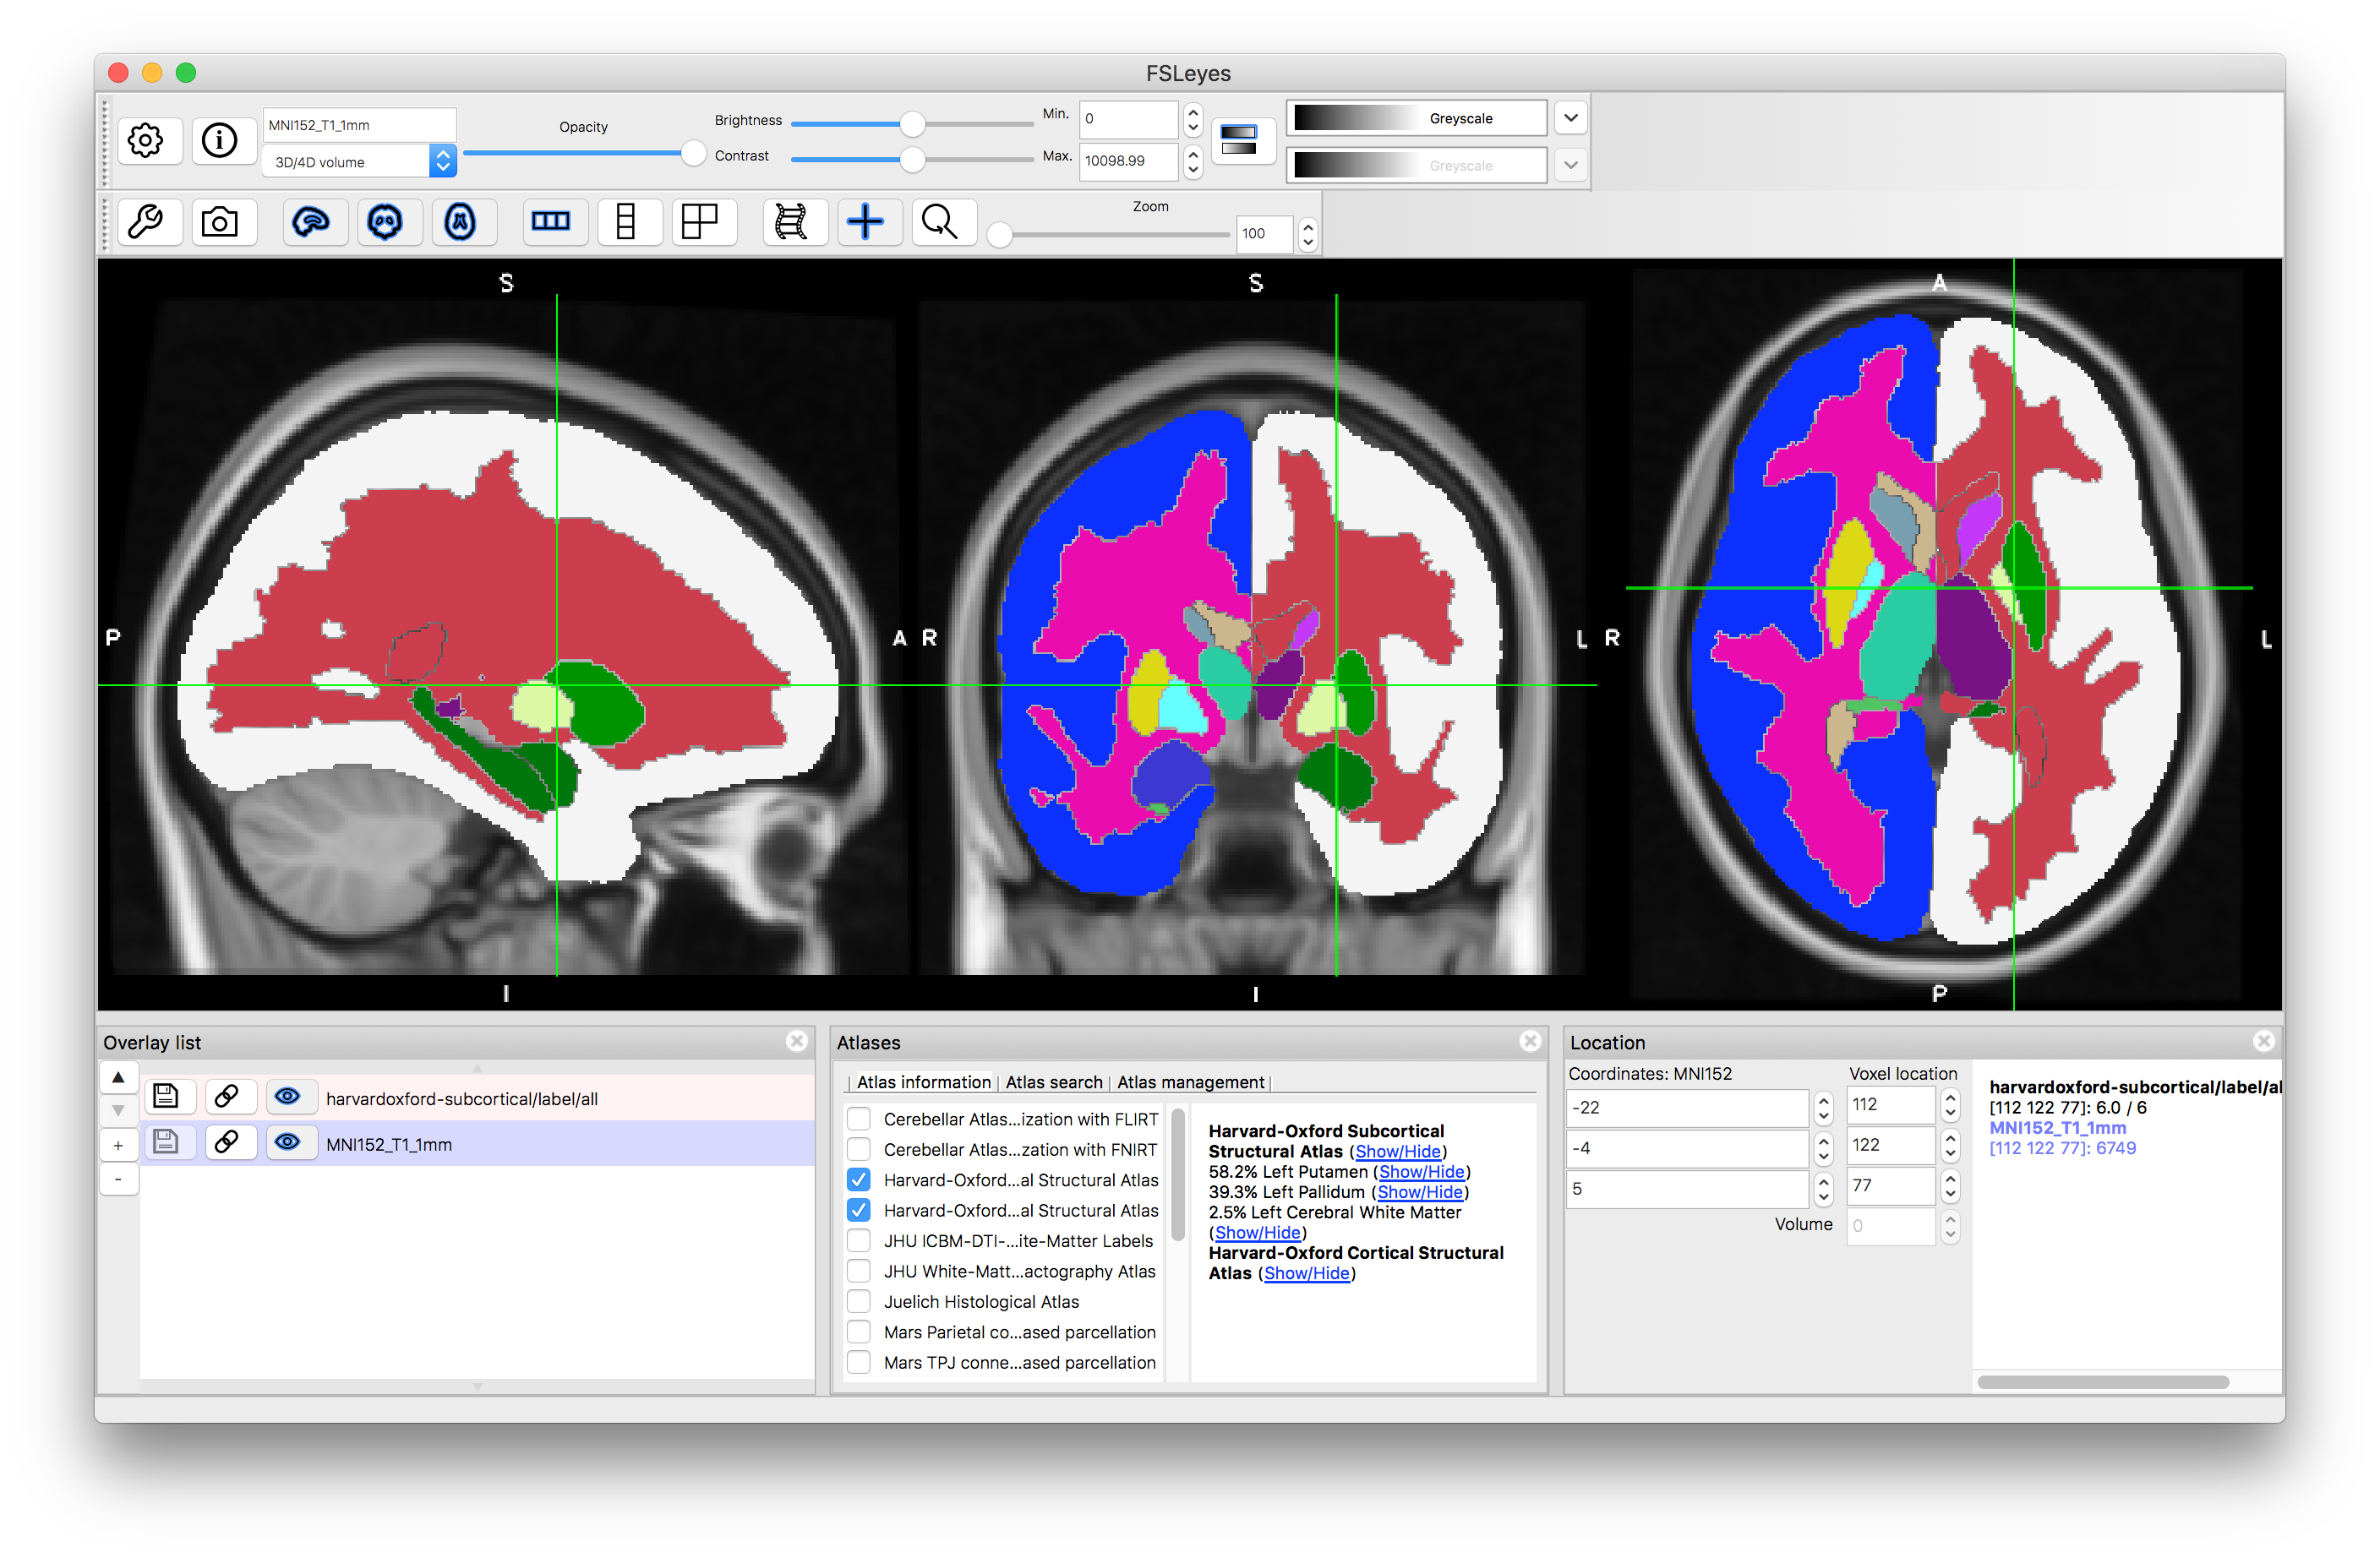
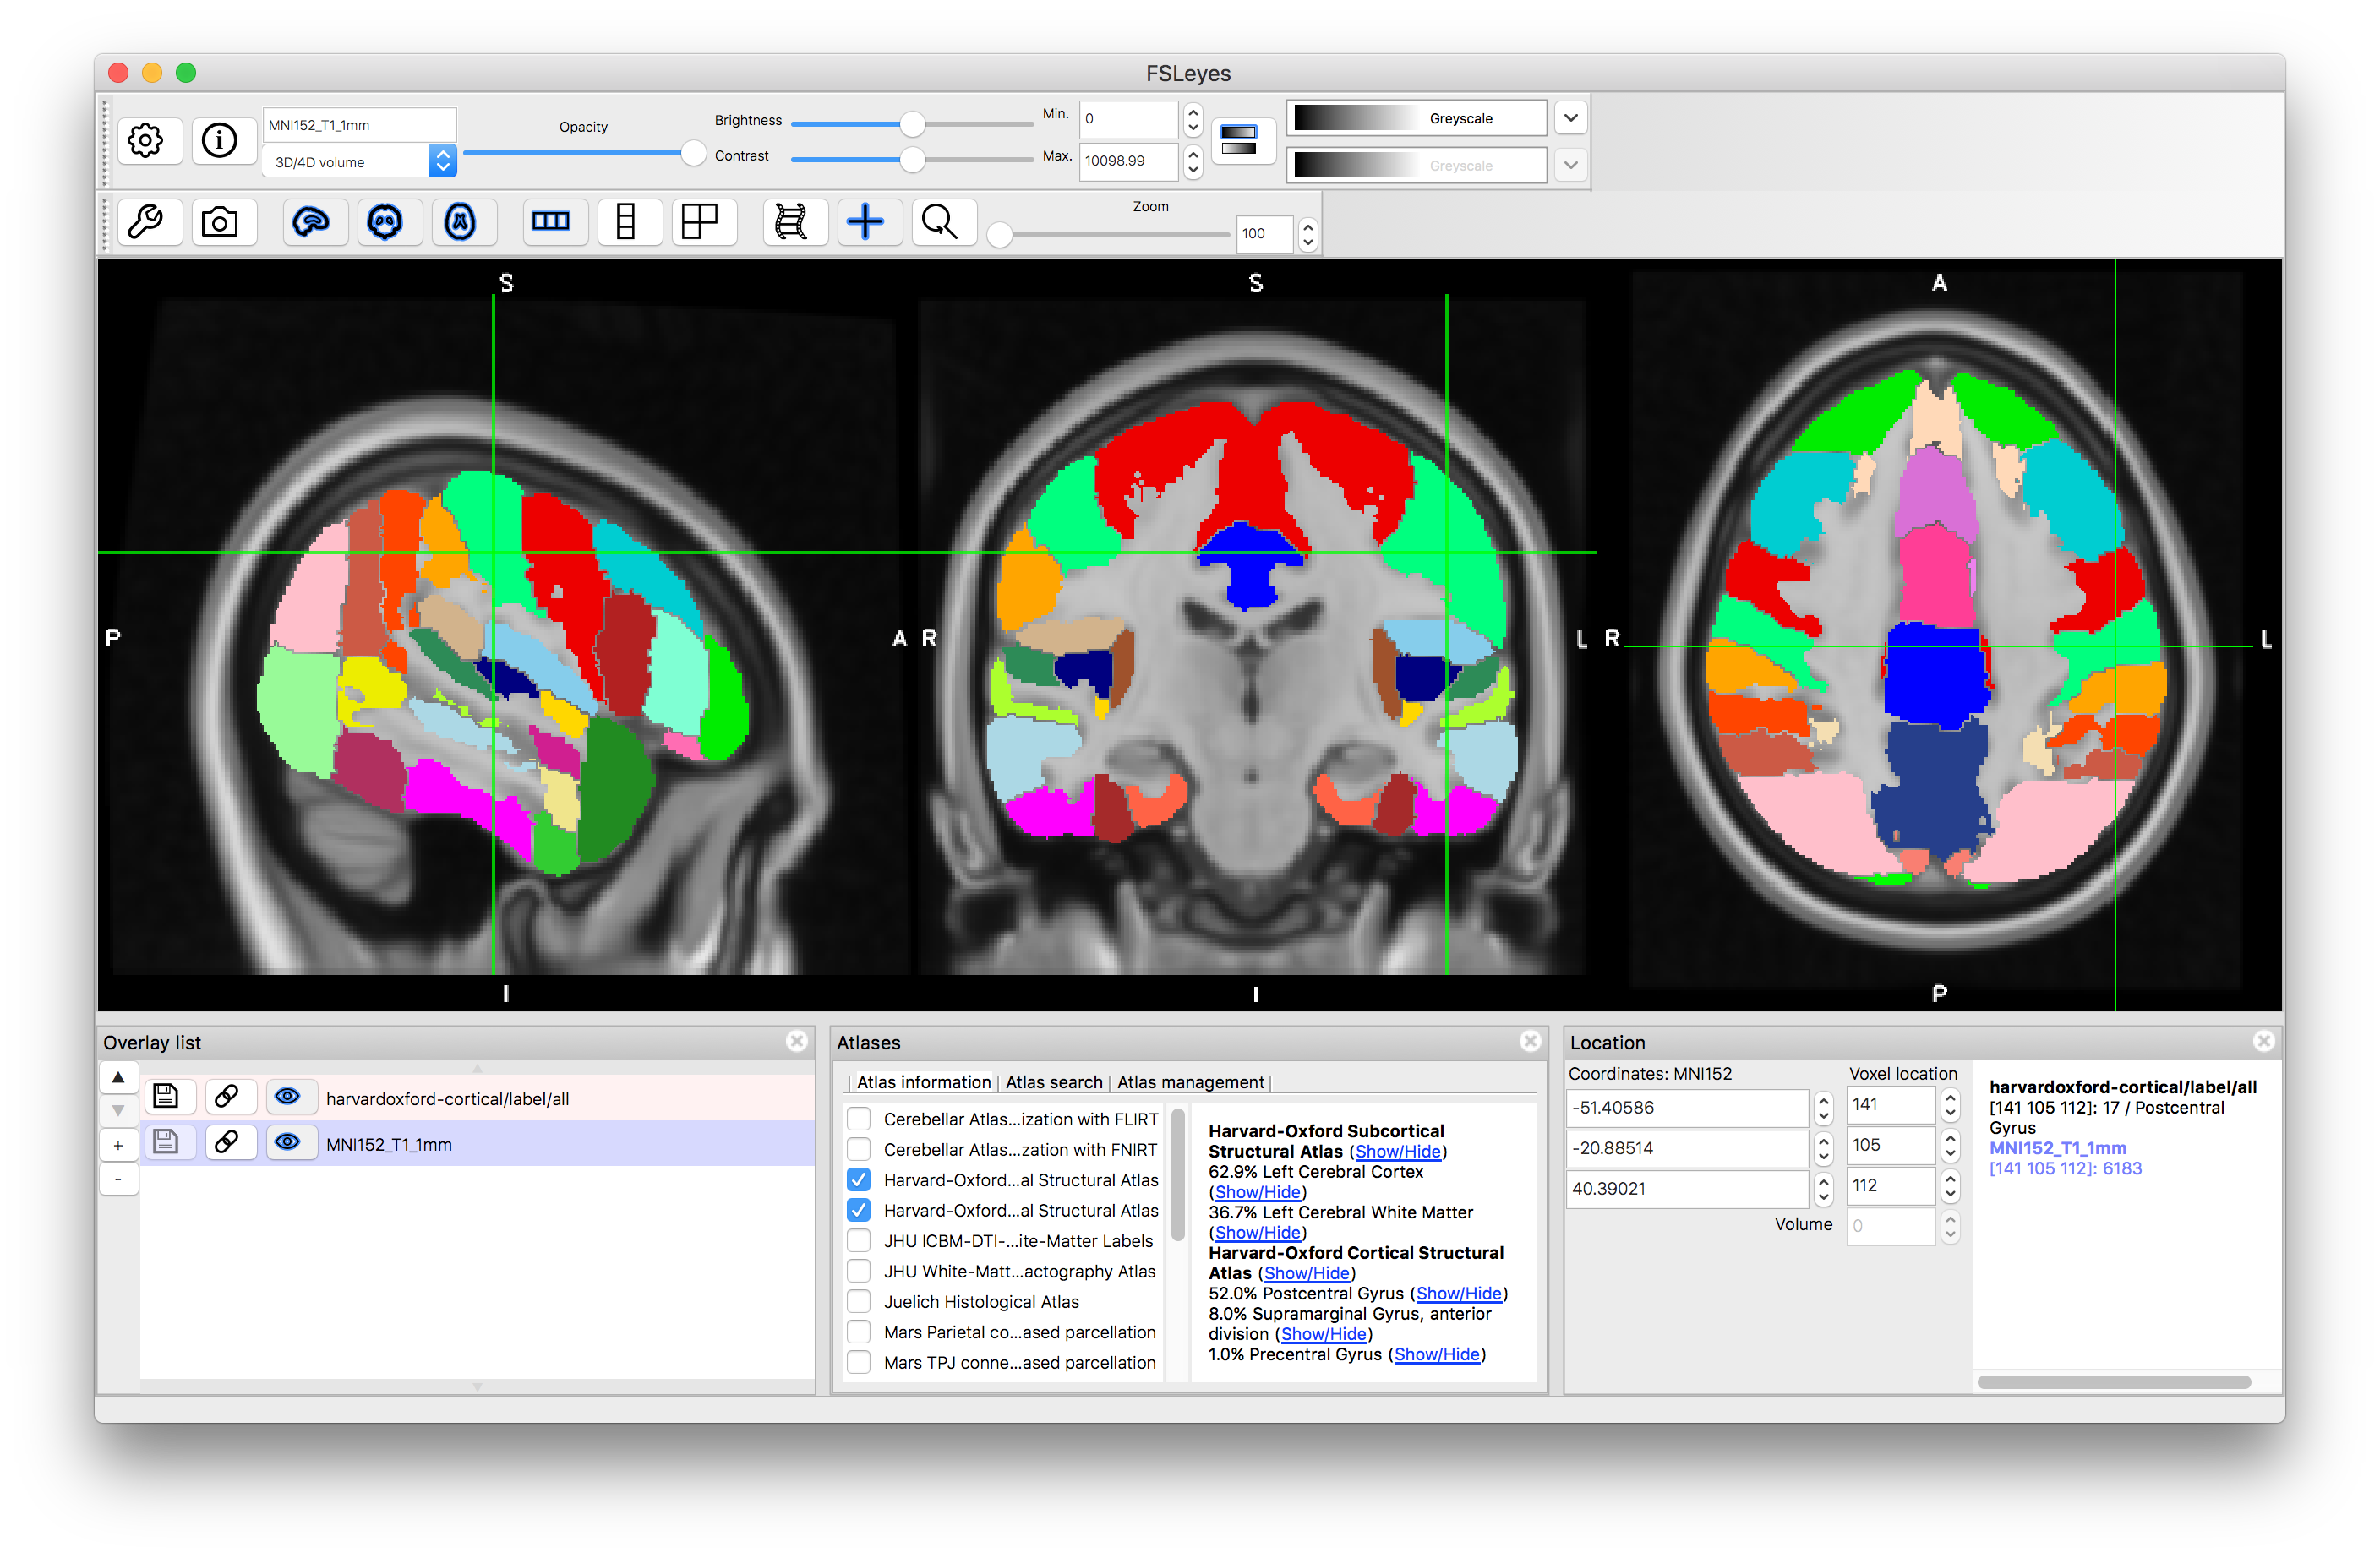
Now click on the (Show/Hide) text next to "Harvard-Oxford Subcortical Structural Atlas". This will display all structures that are present in this atlas (as a set of discrete labels derived from taking the structure with the maximum probability at each location). The information in this atlas is derived from manual segmentations of T1-weighted images of a group of subjects, and hence combines information from the T1-weighted images with higher-level information about structure shape and characteristics known by the neuroanatomists who segmented the images. You can hide this label image by clicking on the text again.
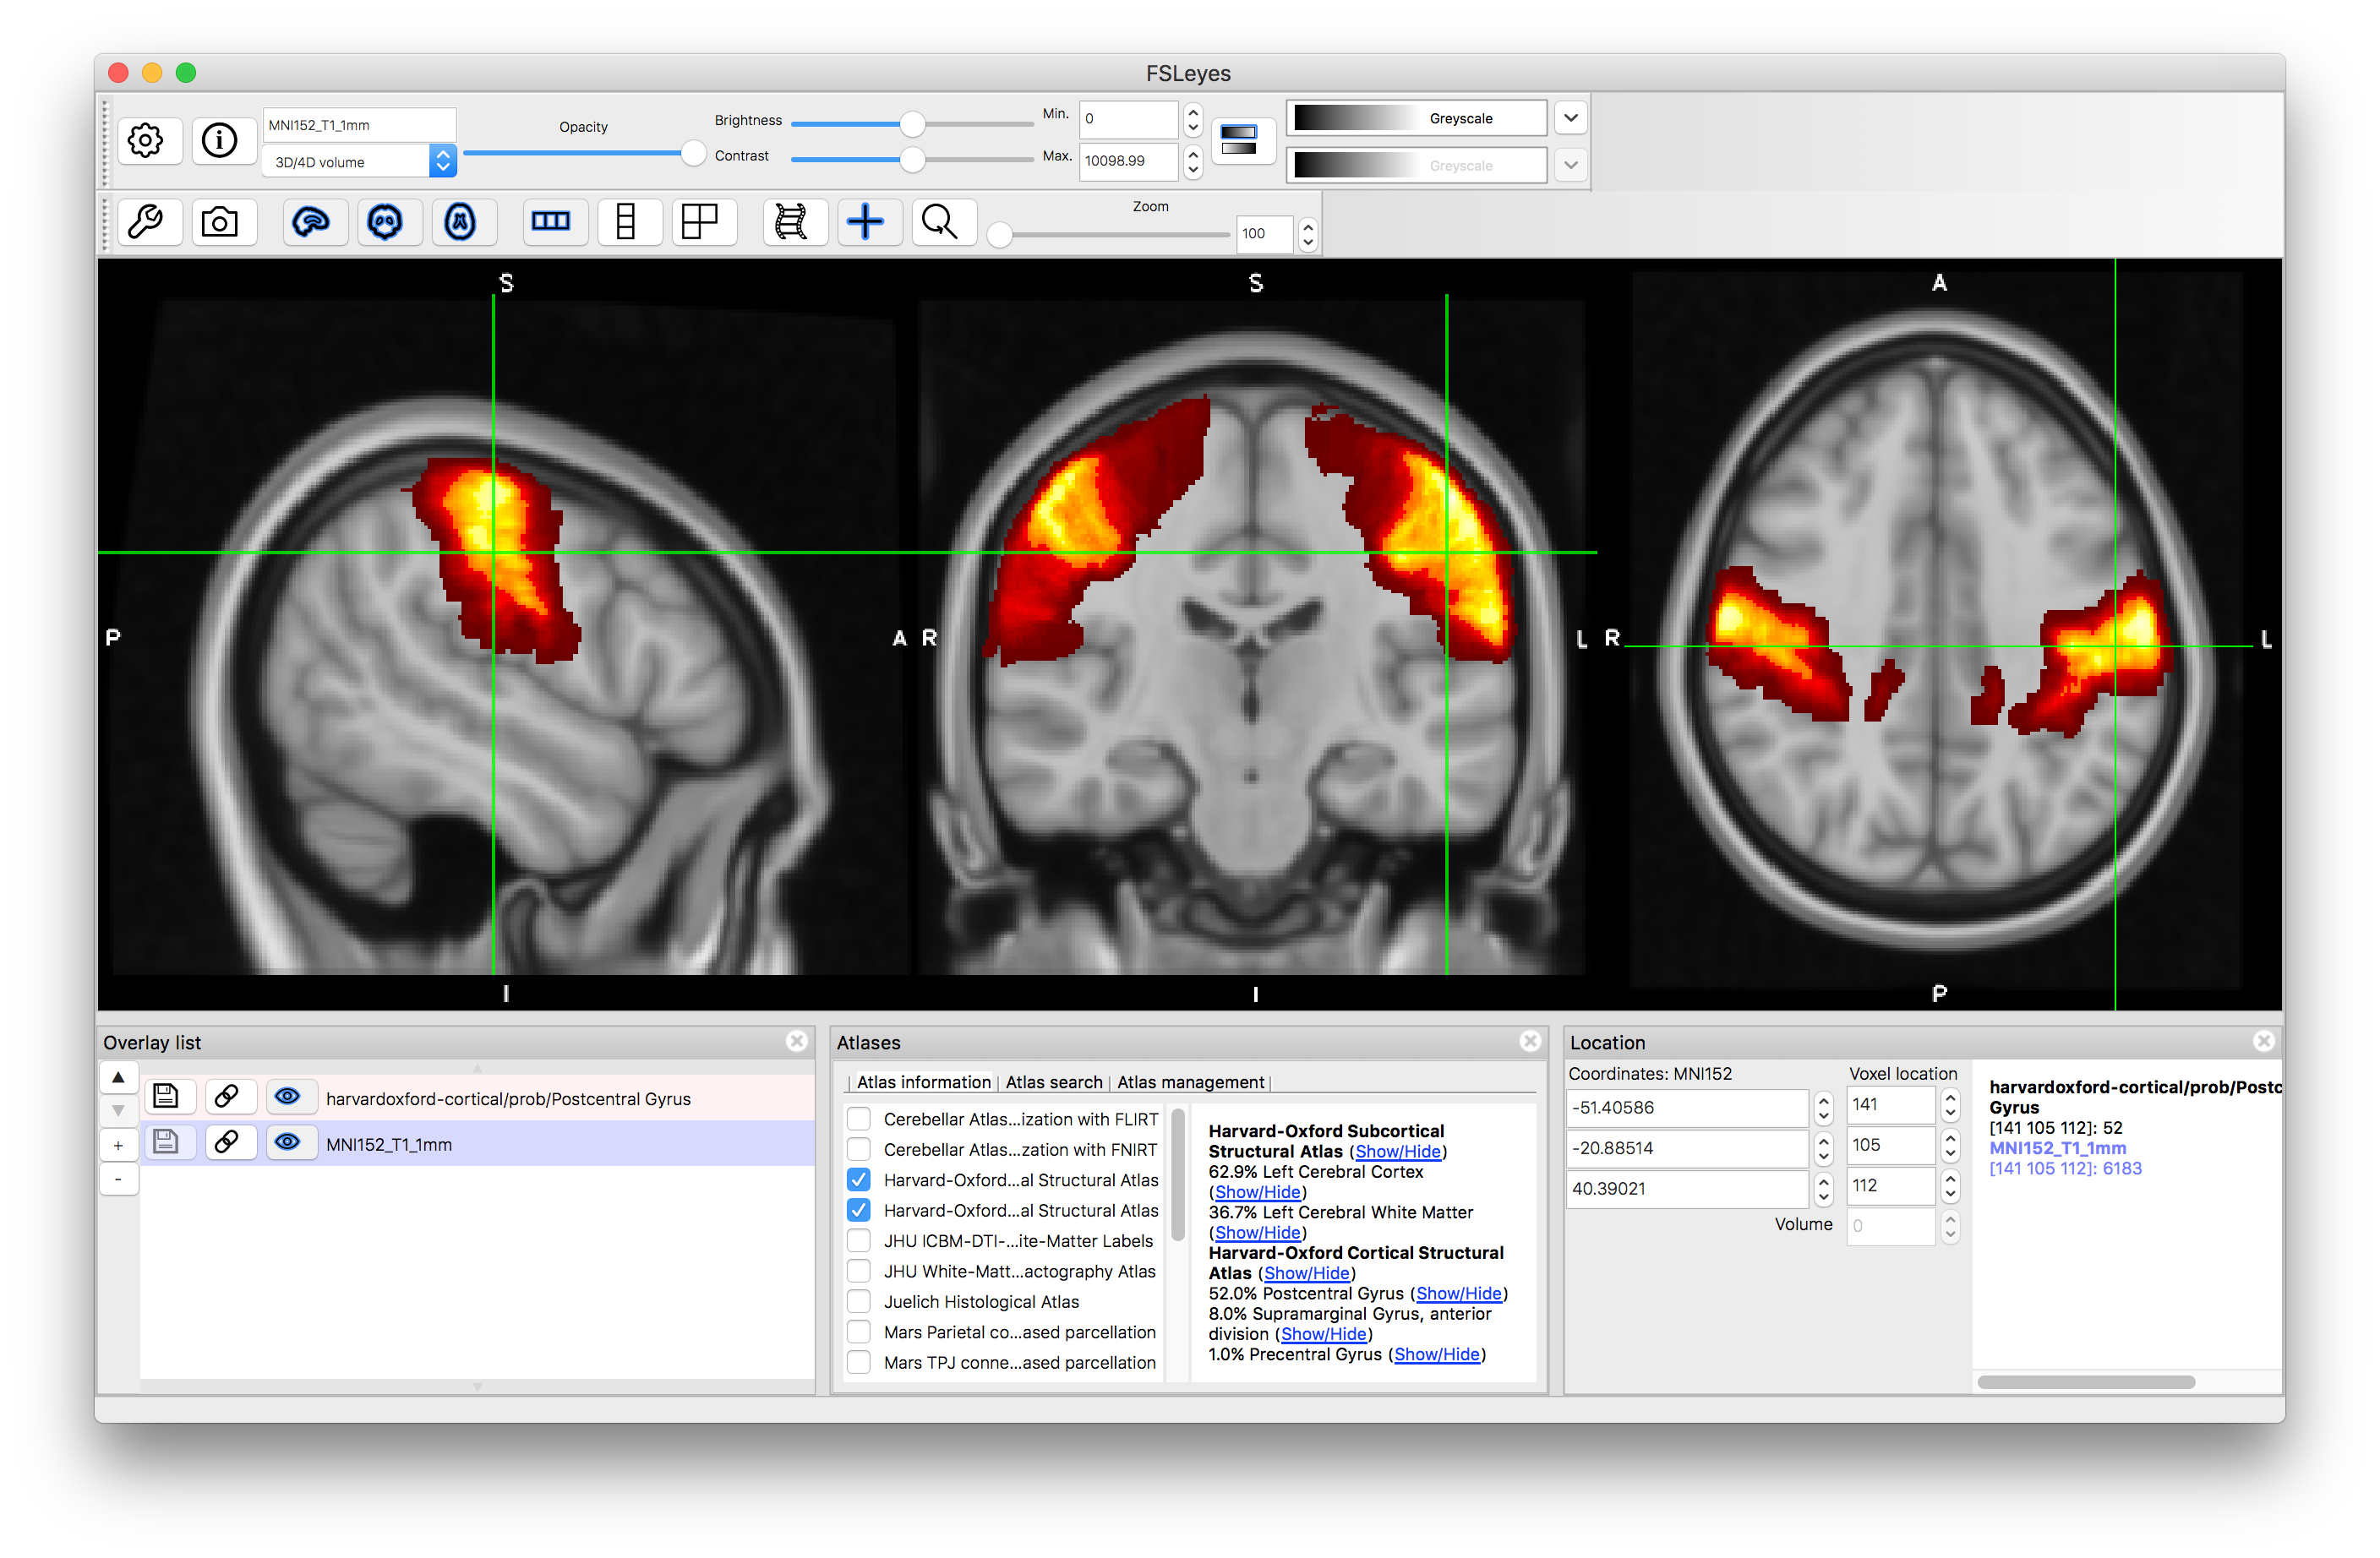
Click on the (Show/Hide) text next to "Left Putamen". This will display the probabilities associated with this structure. If you click around in the image you will see the probability (as a percentage value: from 0 to 100) displayed in the panel on the lower right (i.e. the "intensity" value in this image is the probability). Hide this image by clicking on the text again.
You can do the same thing for the "Harvard-Oxford Cortical Structural Atlas" which gives information about areas in the Grey Matter cortex.
It is also possible to search for specific structures. Go to the Atlas Panel and click on the "Atlas Search" tab, then enter a search term (e.g. "hippocampus"). This will then highlight the atlases that contain that search term in bold within the atlas list and if you select one then it will give you a list (on the right) of all individual structures that match the search term (as well as showing the label image for that atlas). Selecting the box on the left of that line will display the individual structure's probability and clicking on the "+" button will then shift the crosshairs to a position in the middle of that structure.
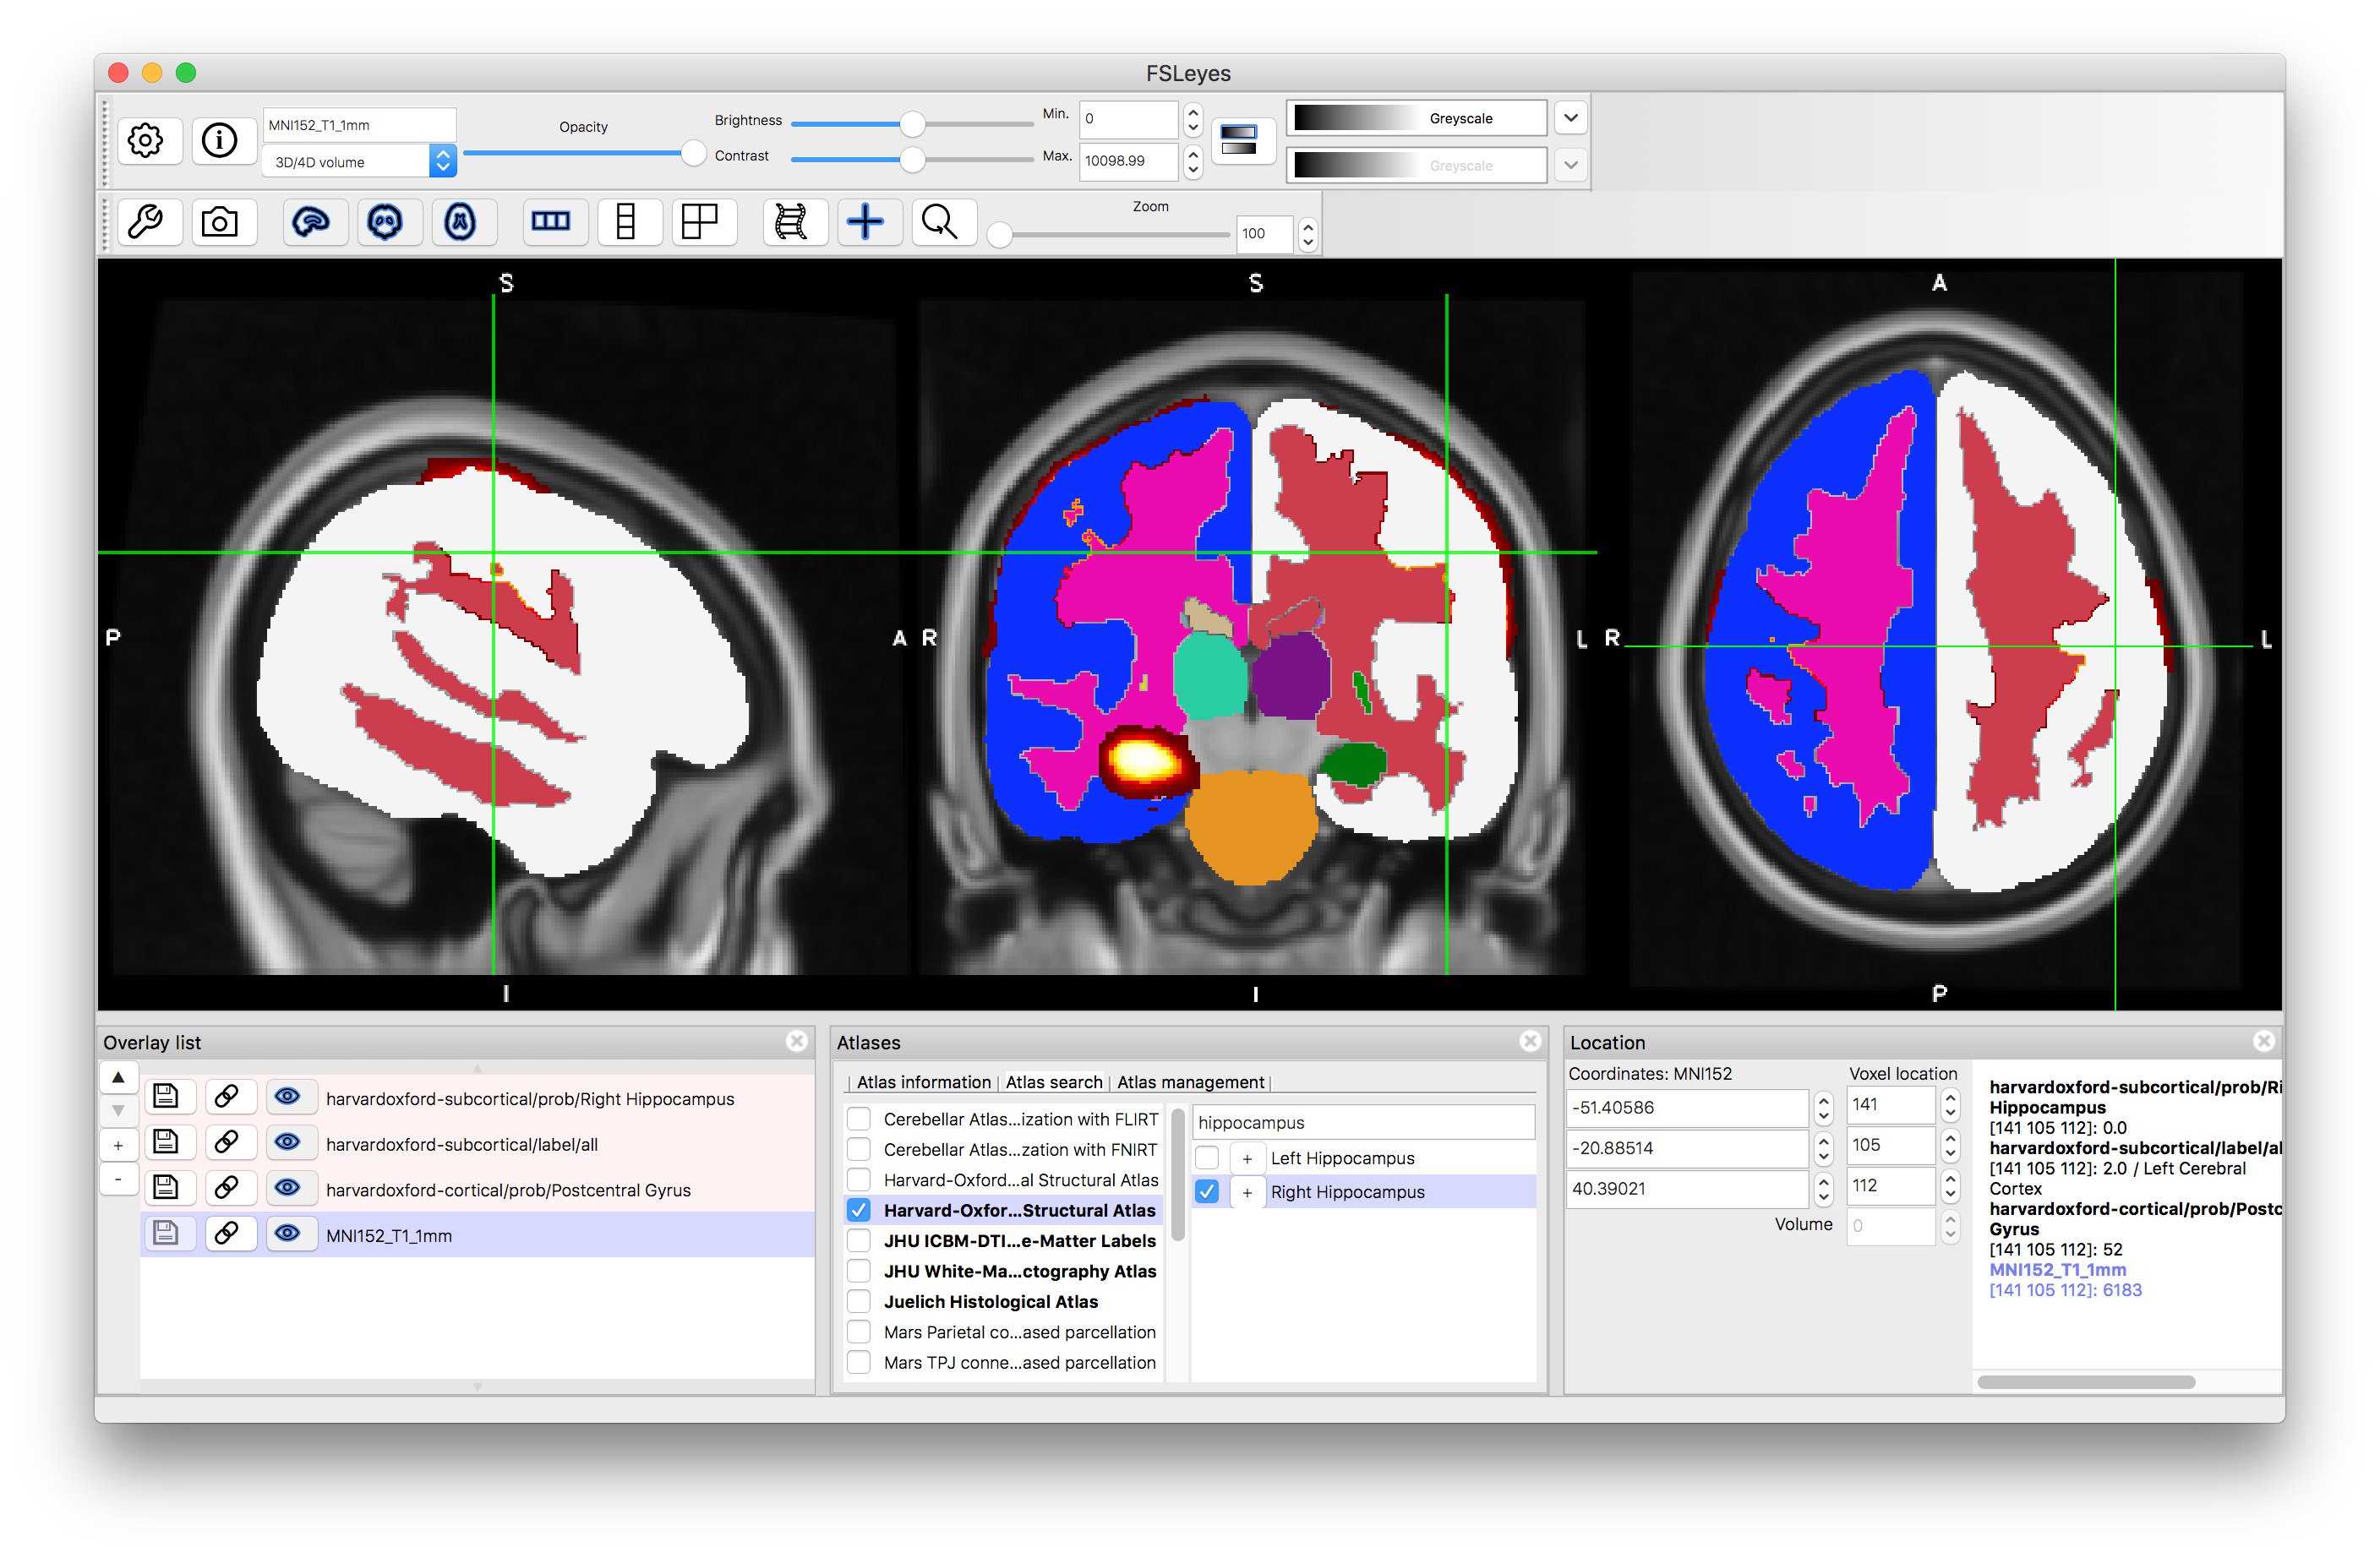
After clicking "+":
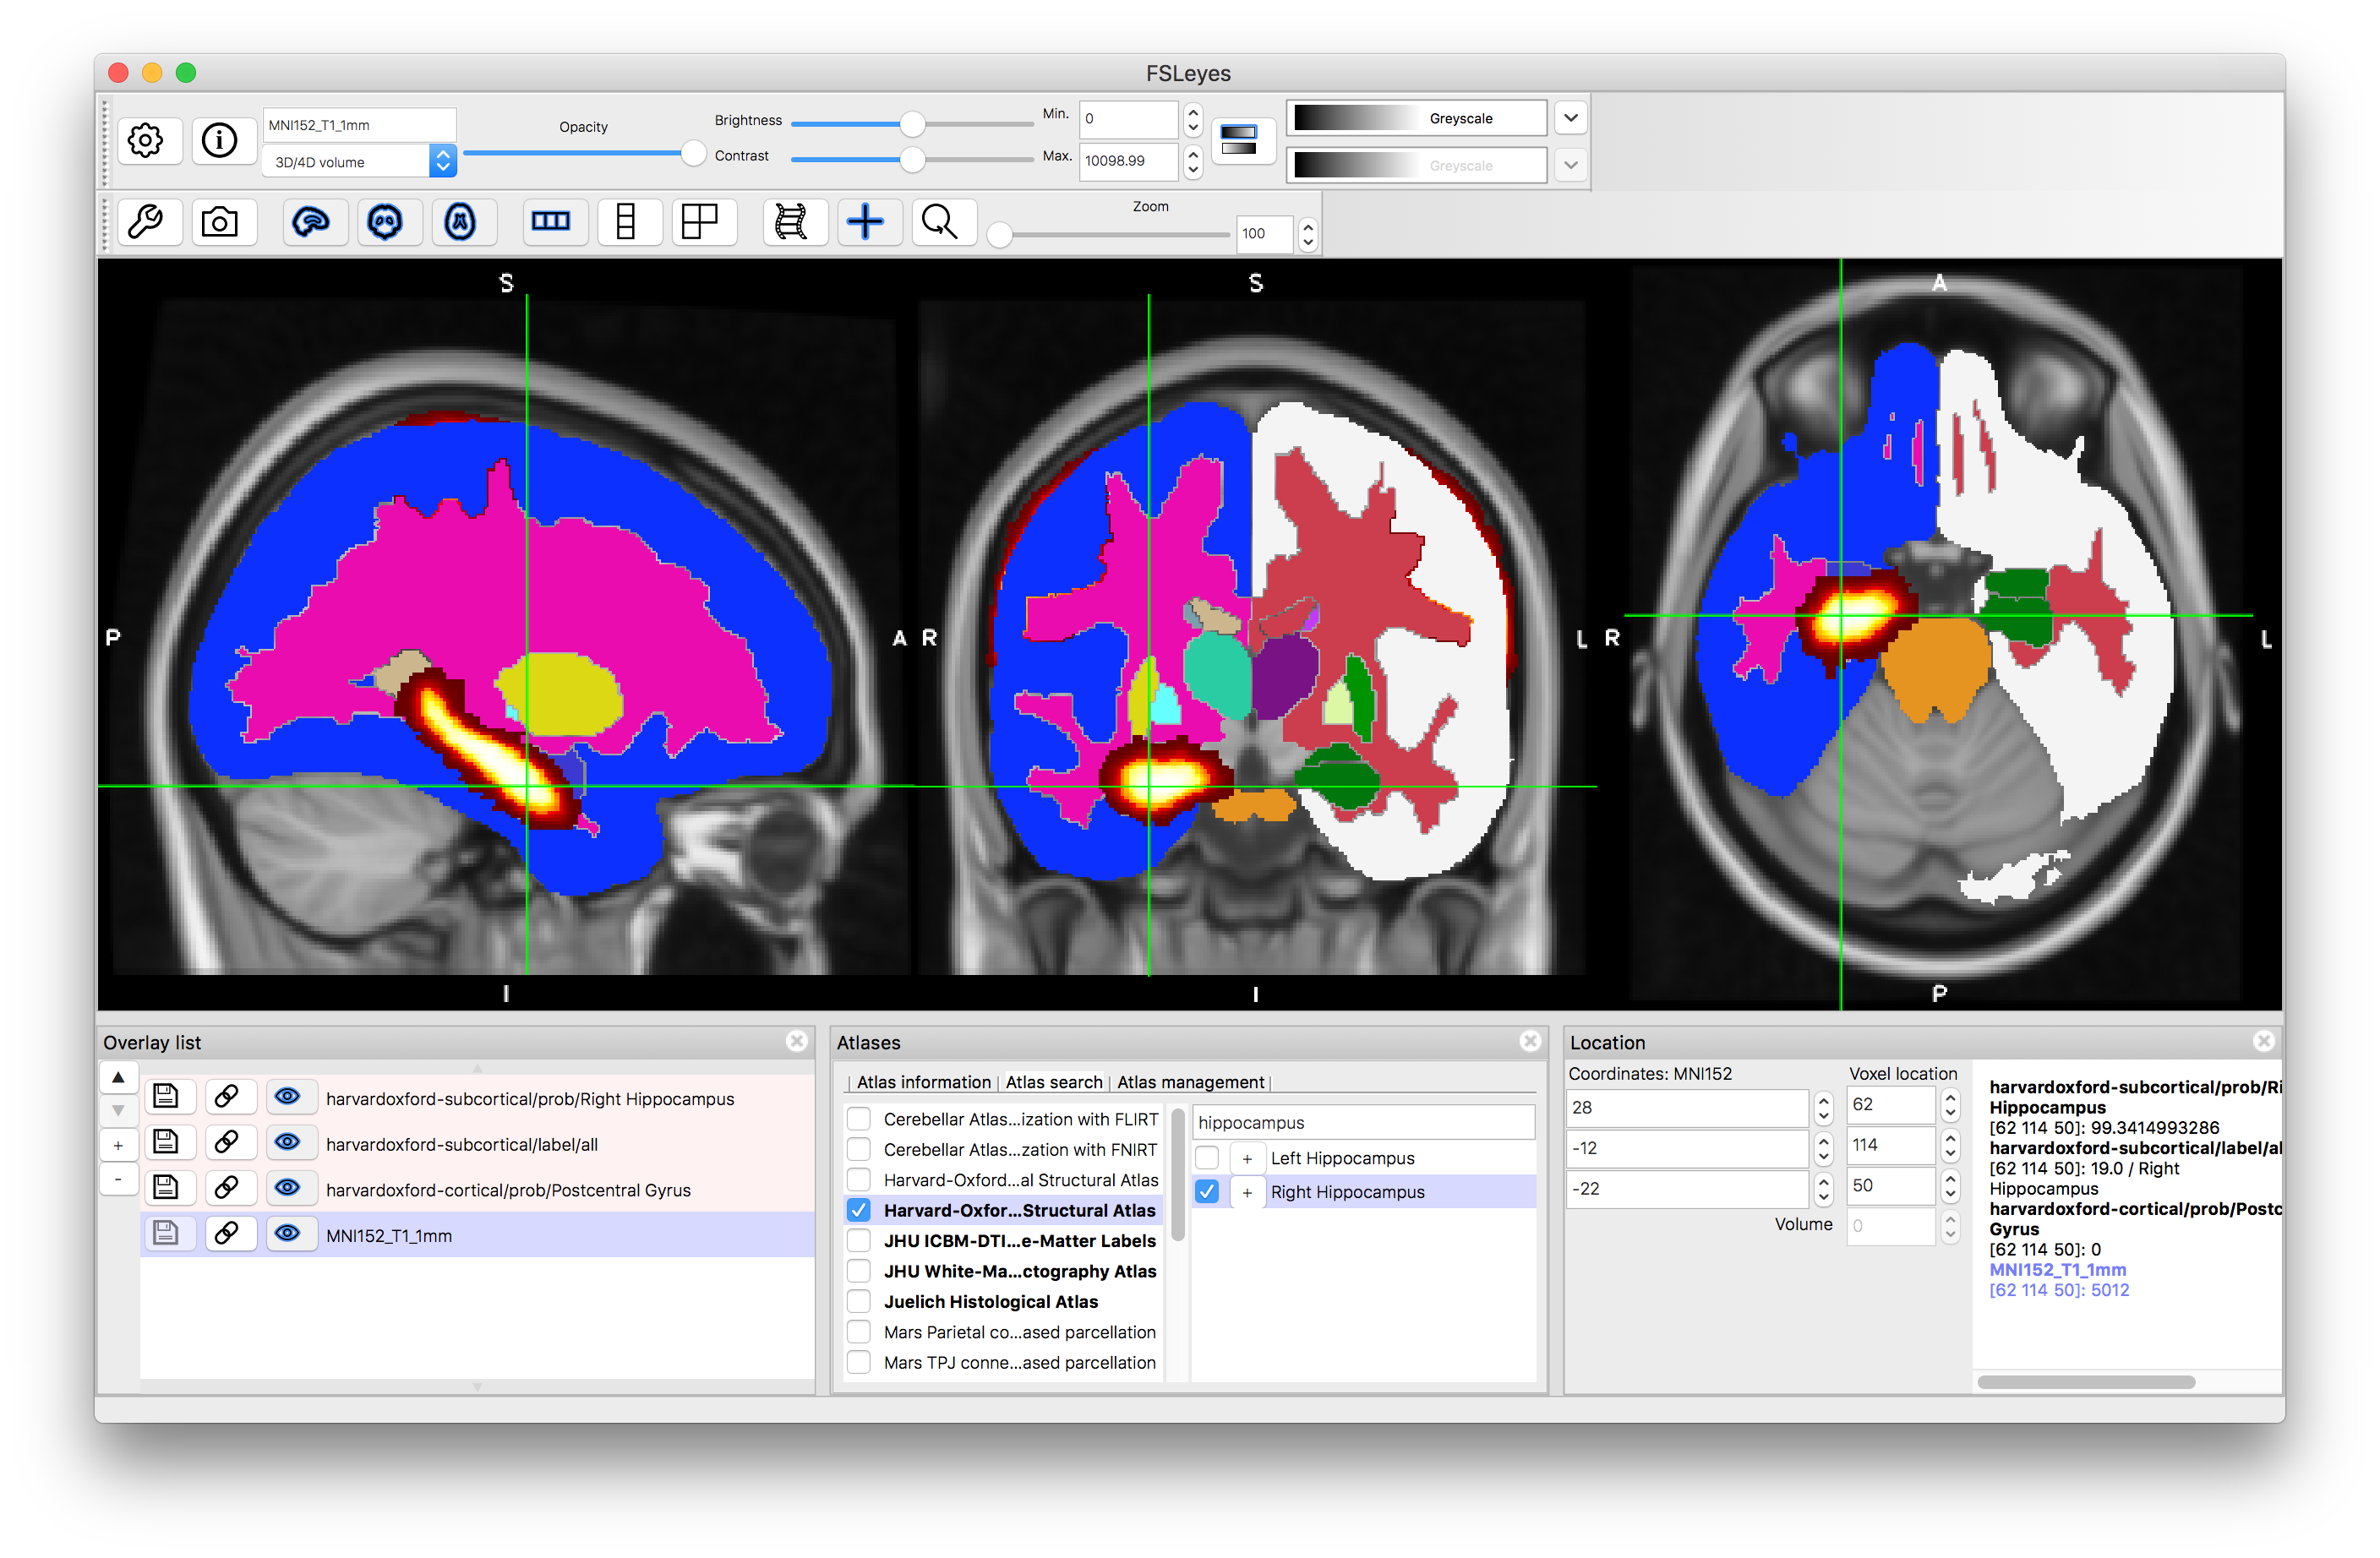
Note that all the images that are displayed are also shown in the Overlay List (bottom left panel) and can be manipulated (e.g., turned on and off, have colourmaps changed, etc.) like any other image. However, they are temporary and will typically disappear when "unticked" within atlas panel. They can also be removed by selecting them in the overlay list and using the "-" button there.
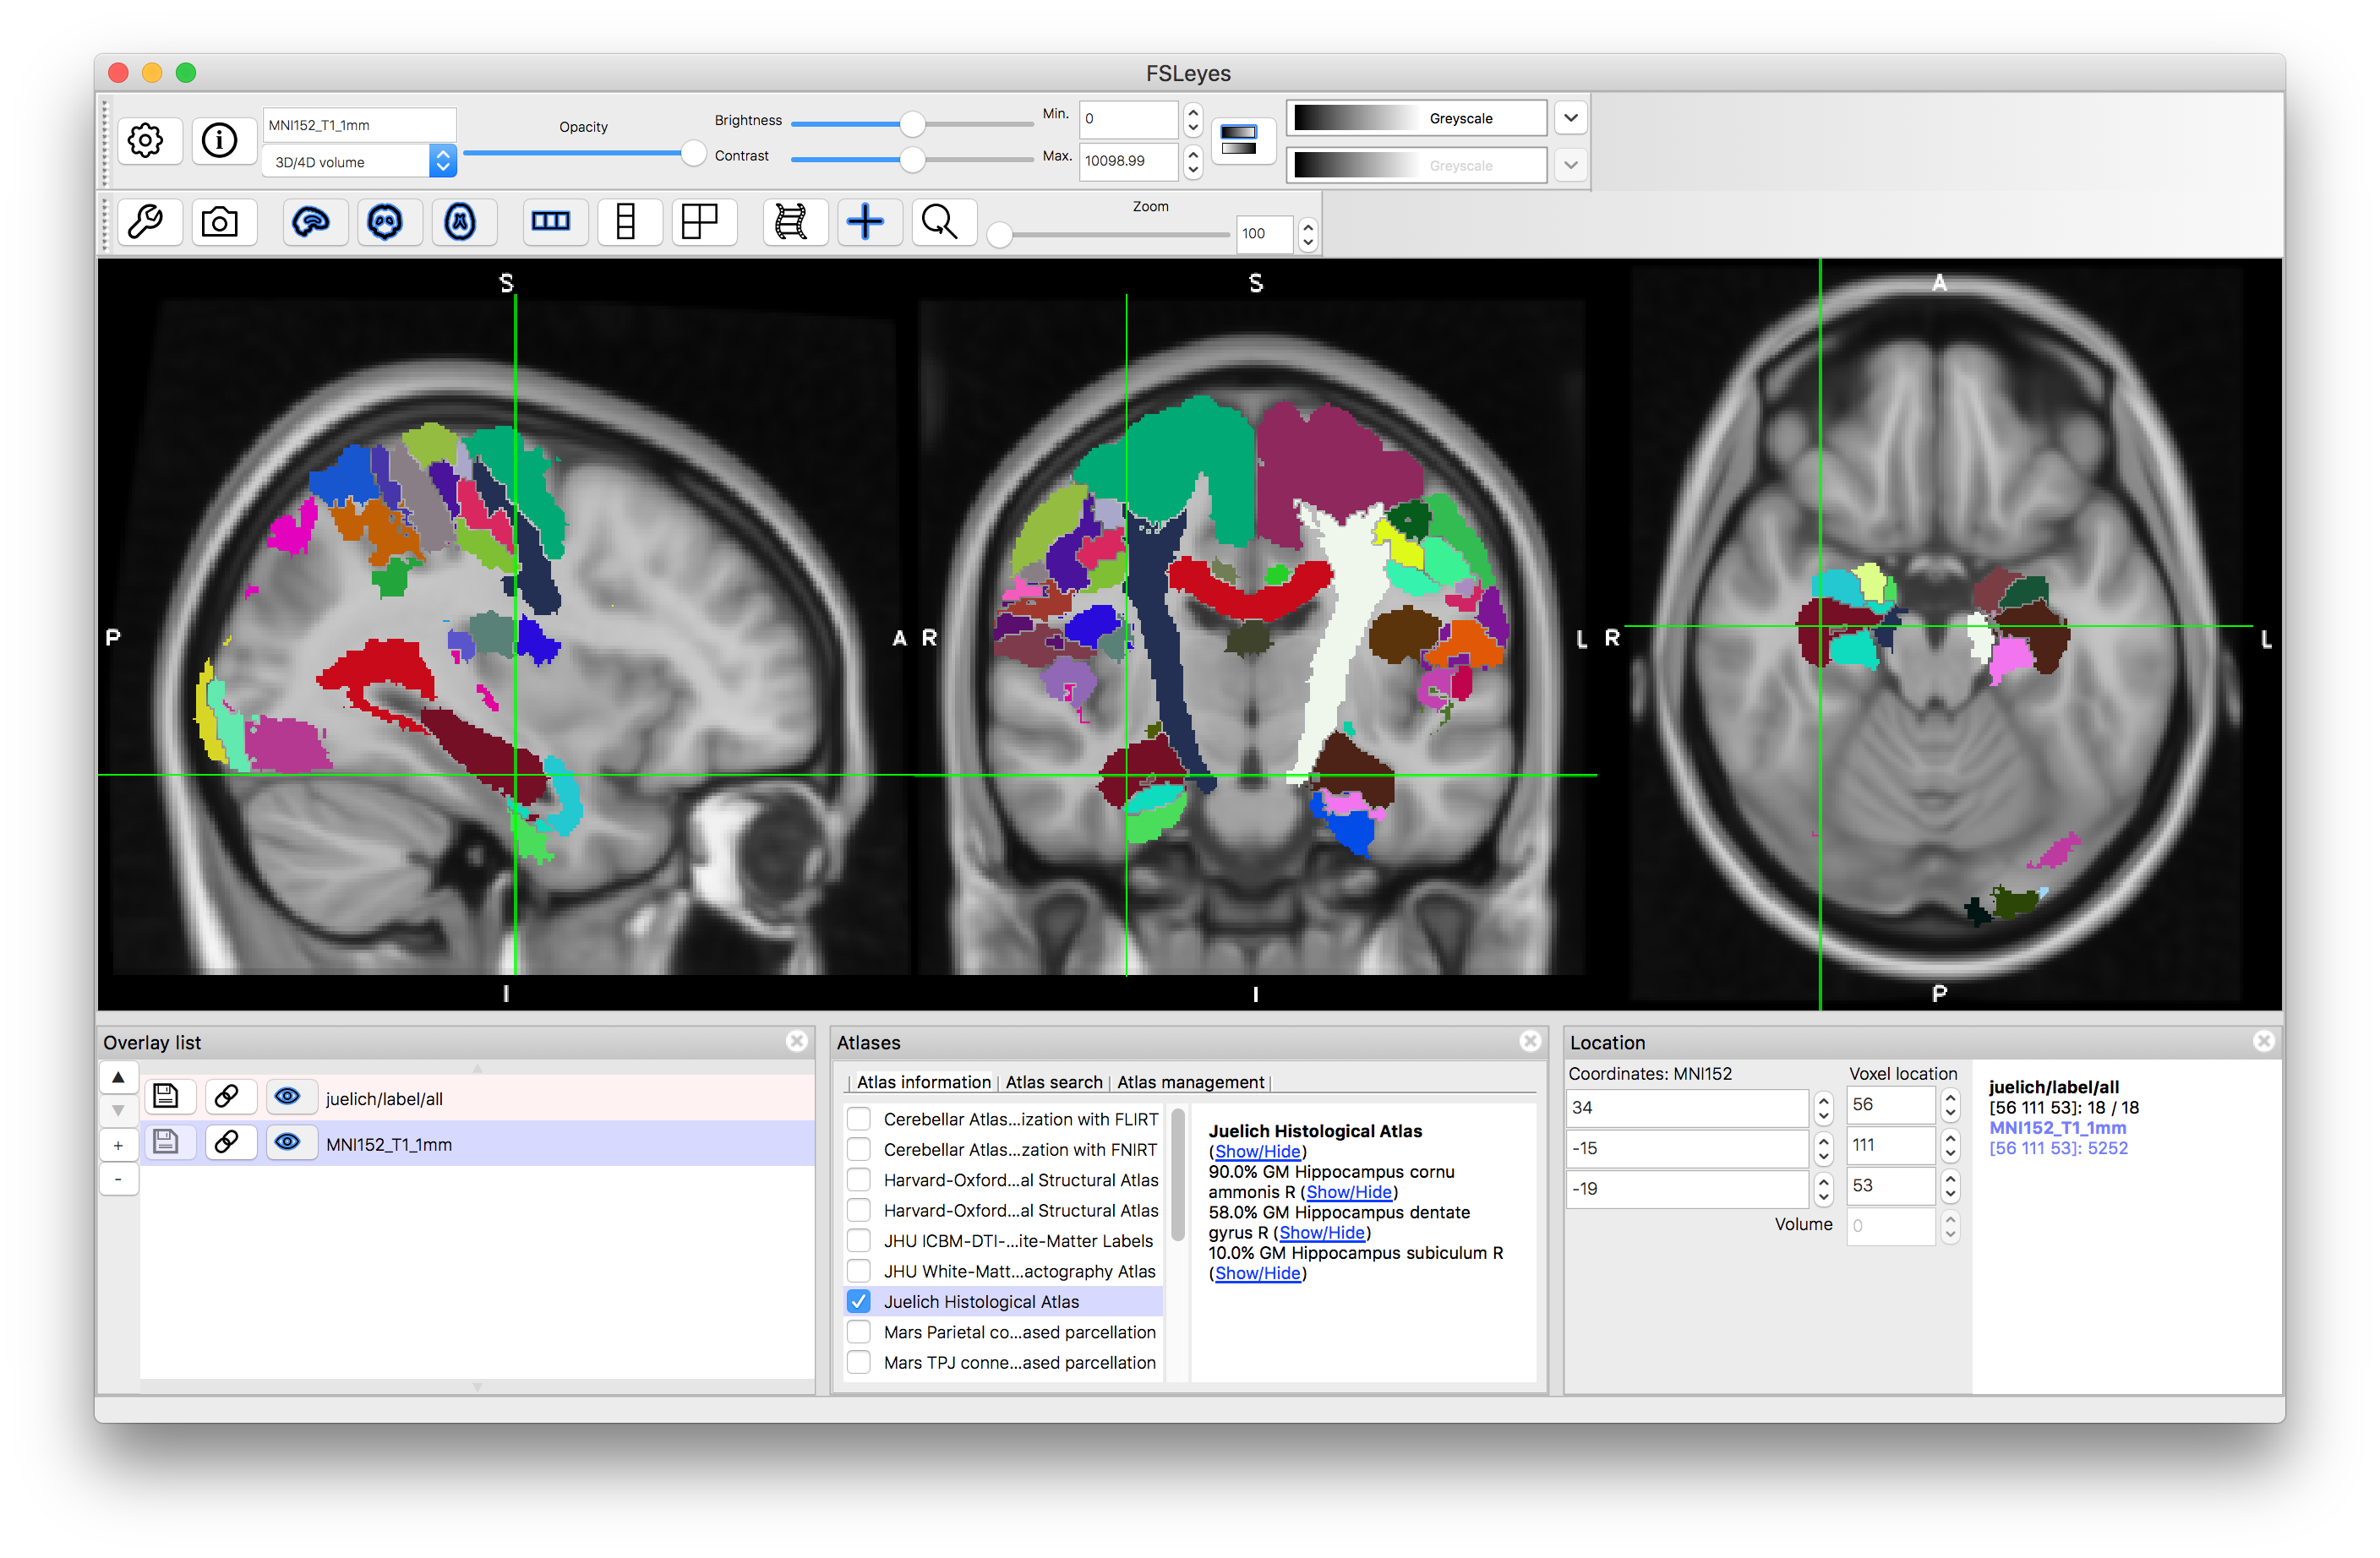
Juelich Atlas
Now go back to the "Atlas information" tab in the Atlas Panel, deselect the Harvard-Oxford atlases and select the "Juelich Histological Atlas". This shows information about a limited set of structures based on data obtained through careful histological analysis from the group in Juelich (see FSL Wiki page for more information). It therefore contains more detailed structures, though again is a probabilistic atlas, so reflects the consistency of these across individuals in any specific location. Only structures for which the detailed histological examinations had been performed are present in this atlas.
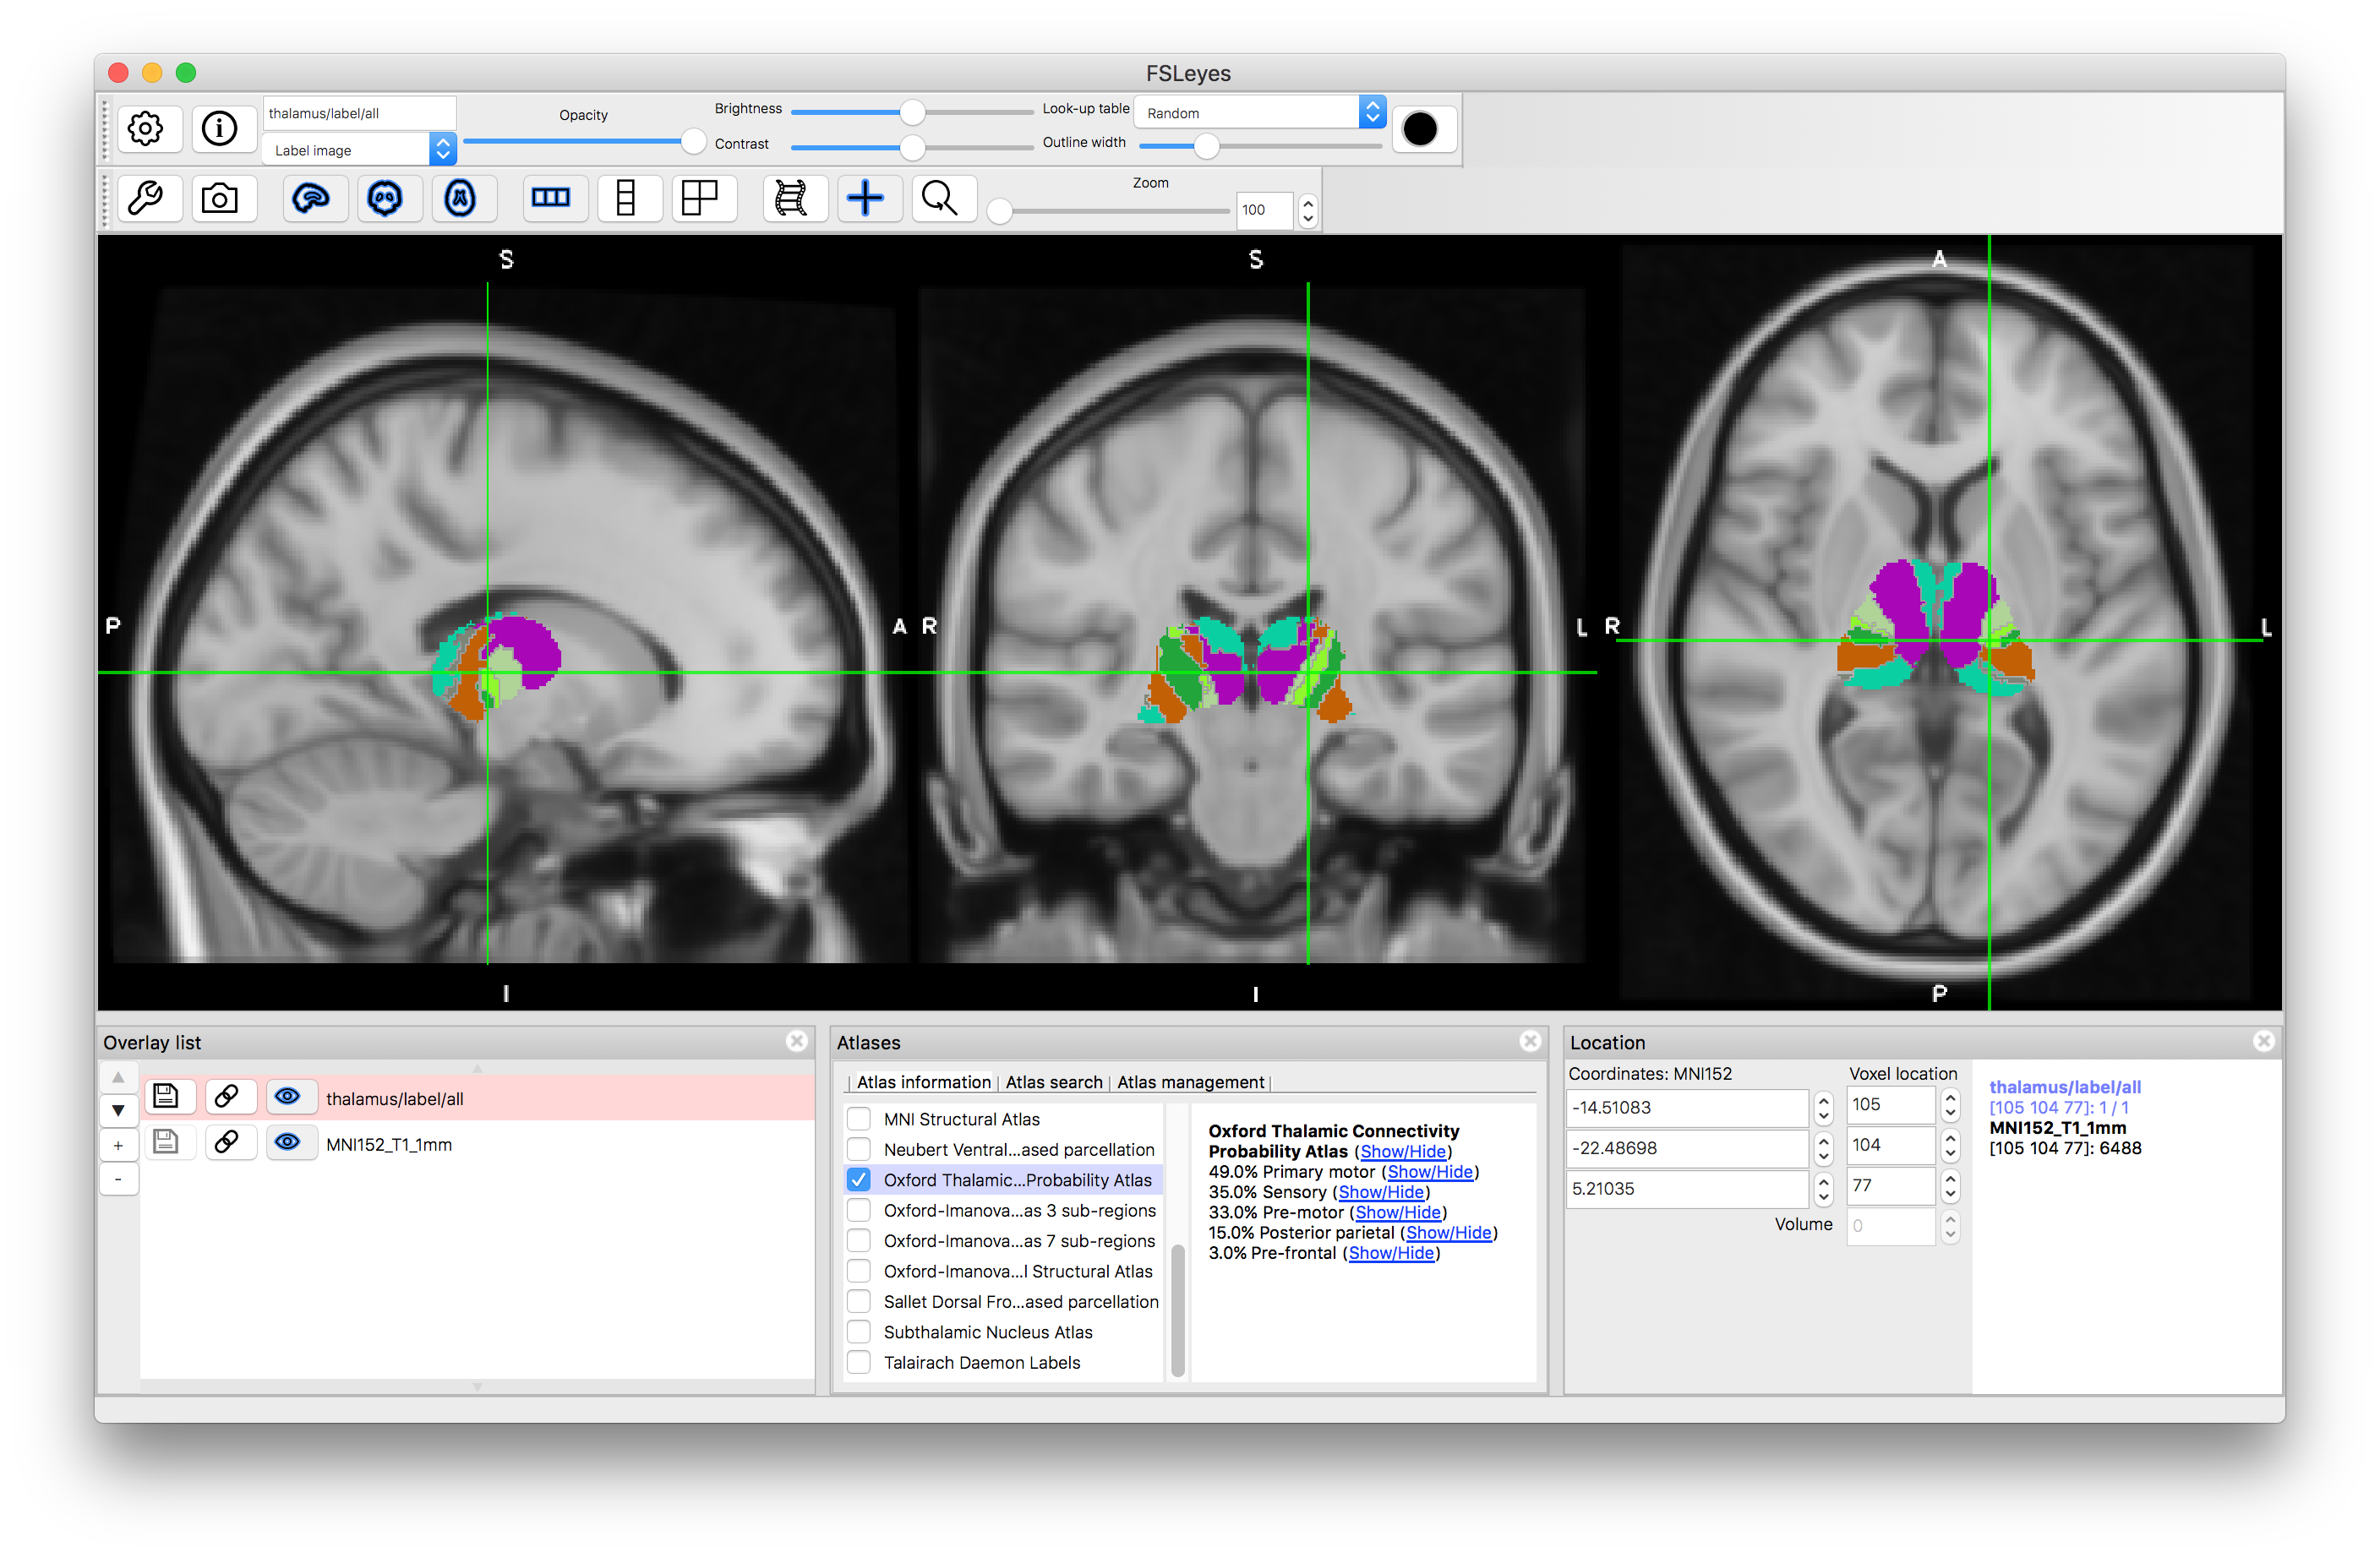
Oxford Thalamic Connectivity Atlas
Deselect the Juelich atlas and select the "Oxford Thalamic Connectivity Probability Atlas". This atlas derives its information from diffusion-based tractography, to determine the connectivity of each part of the thalamus with the cortex. Each part of the thalamus (sub-thalamic regions or nuclei) is associated with different connection probabilities to areas of the cortex (e.g. to primary motor cortex, or to pre-frontal cortex, etc.). The label image shows the label with maximum probability, but individual probabilities for each structure can also be viewed (the same as for the two atlases above).
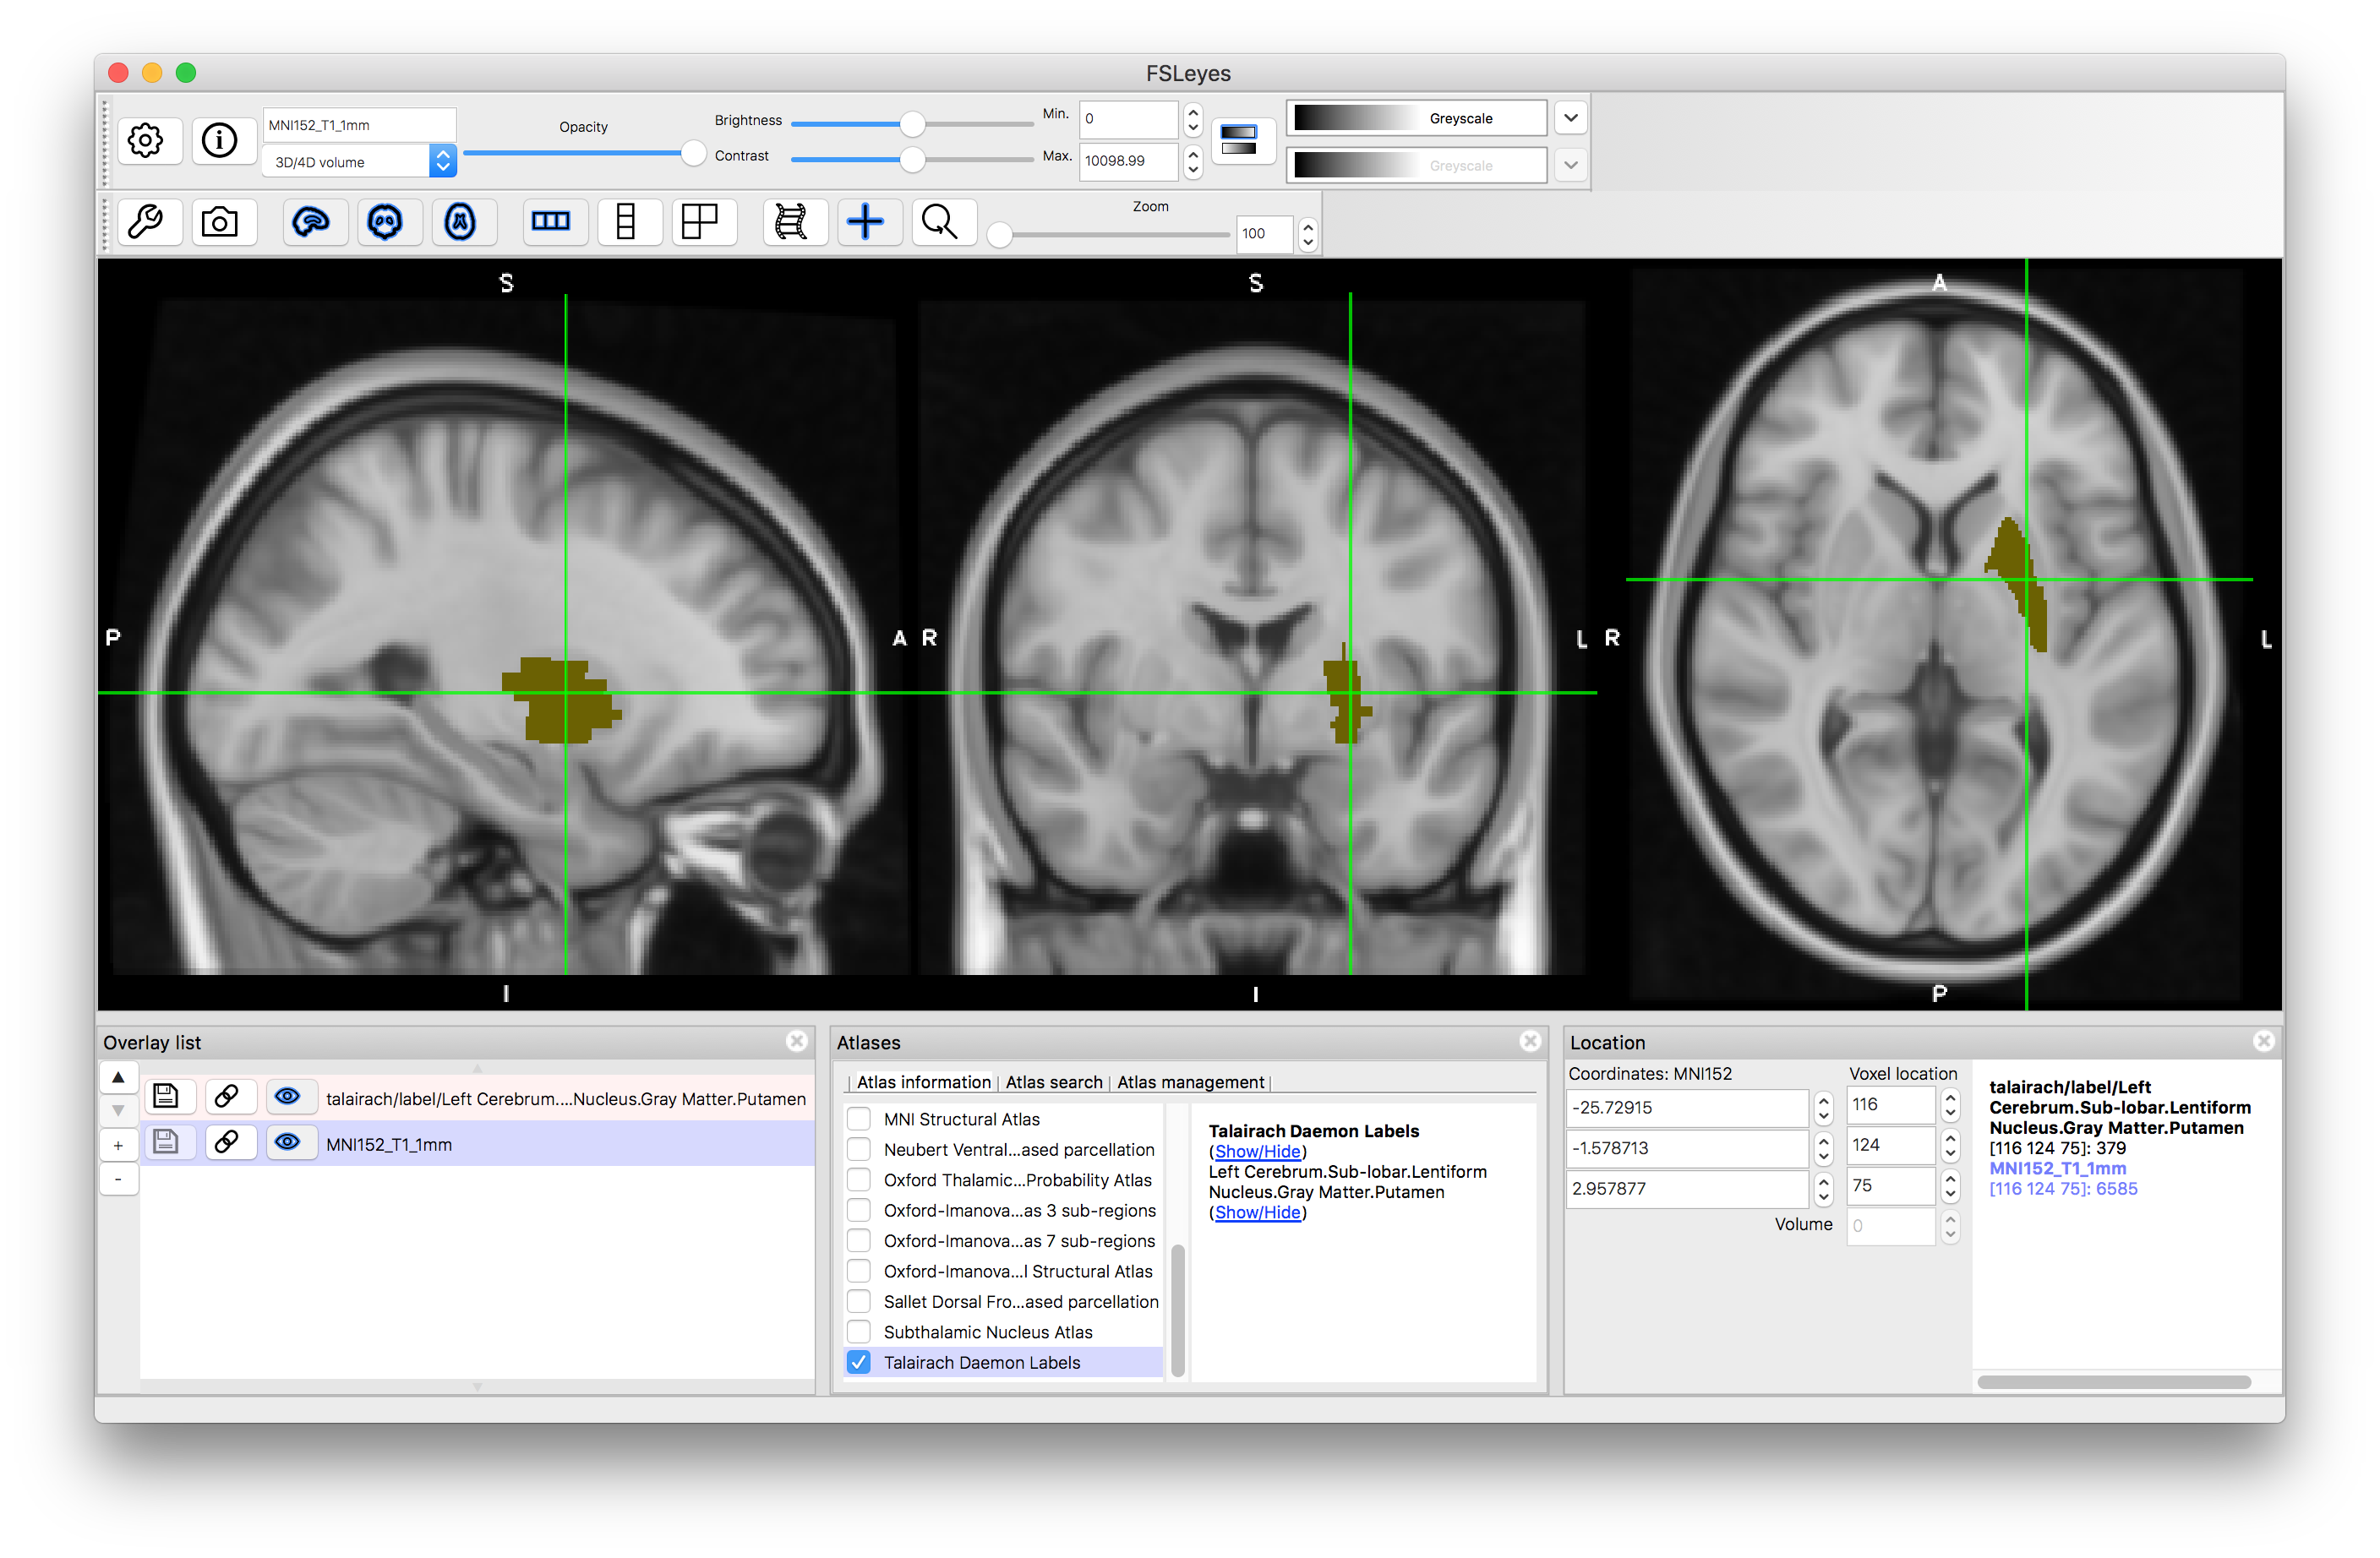
Talairach Daemon Labels
Finally, we will look at the Talairach Daemon Labels, as this is an example of a non-probabilistic atlas. In this case there are very many labels, but each structure is a simple binary label (see example of putamen below). Hence you do not see percentages within the Atlas Panel, as each location is associated with a single label and that is all the information contained in this atlas.
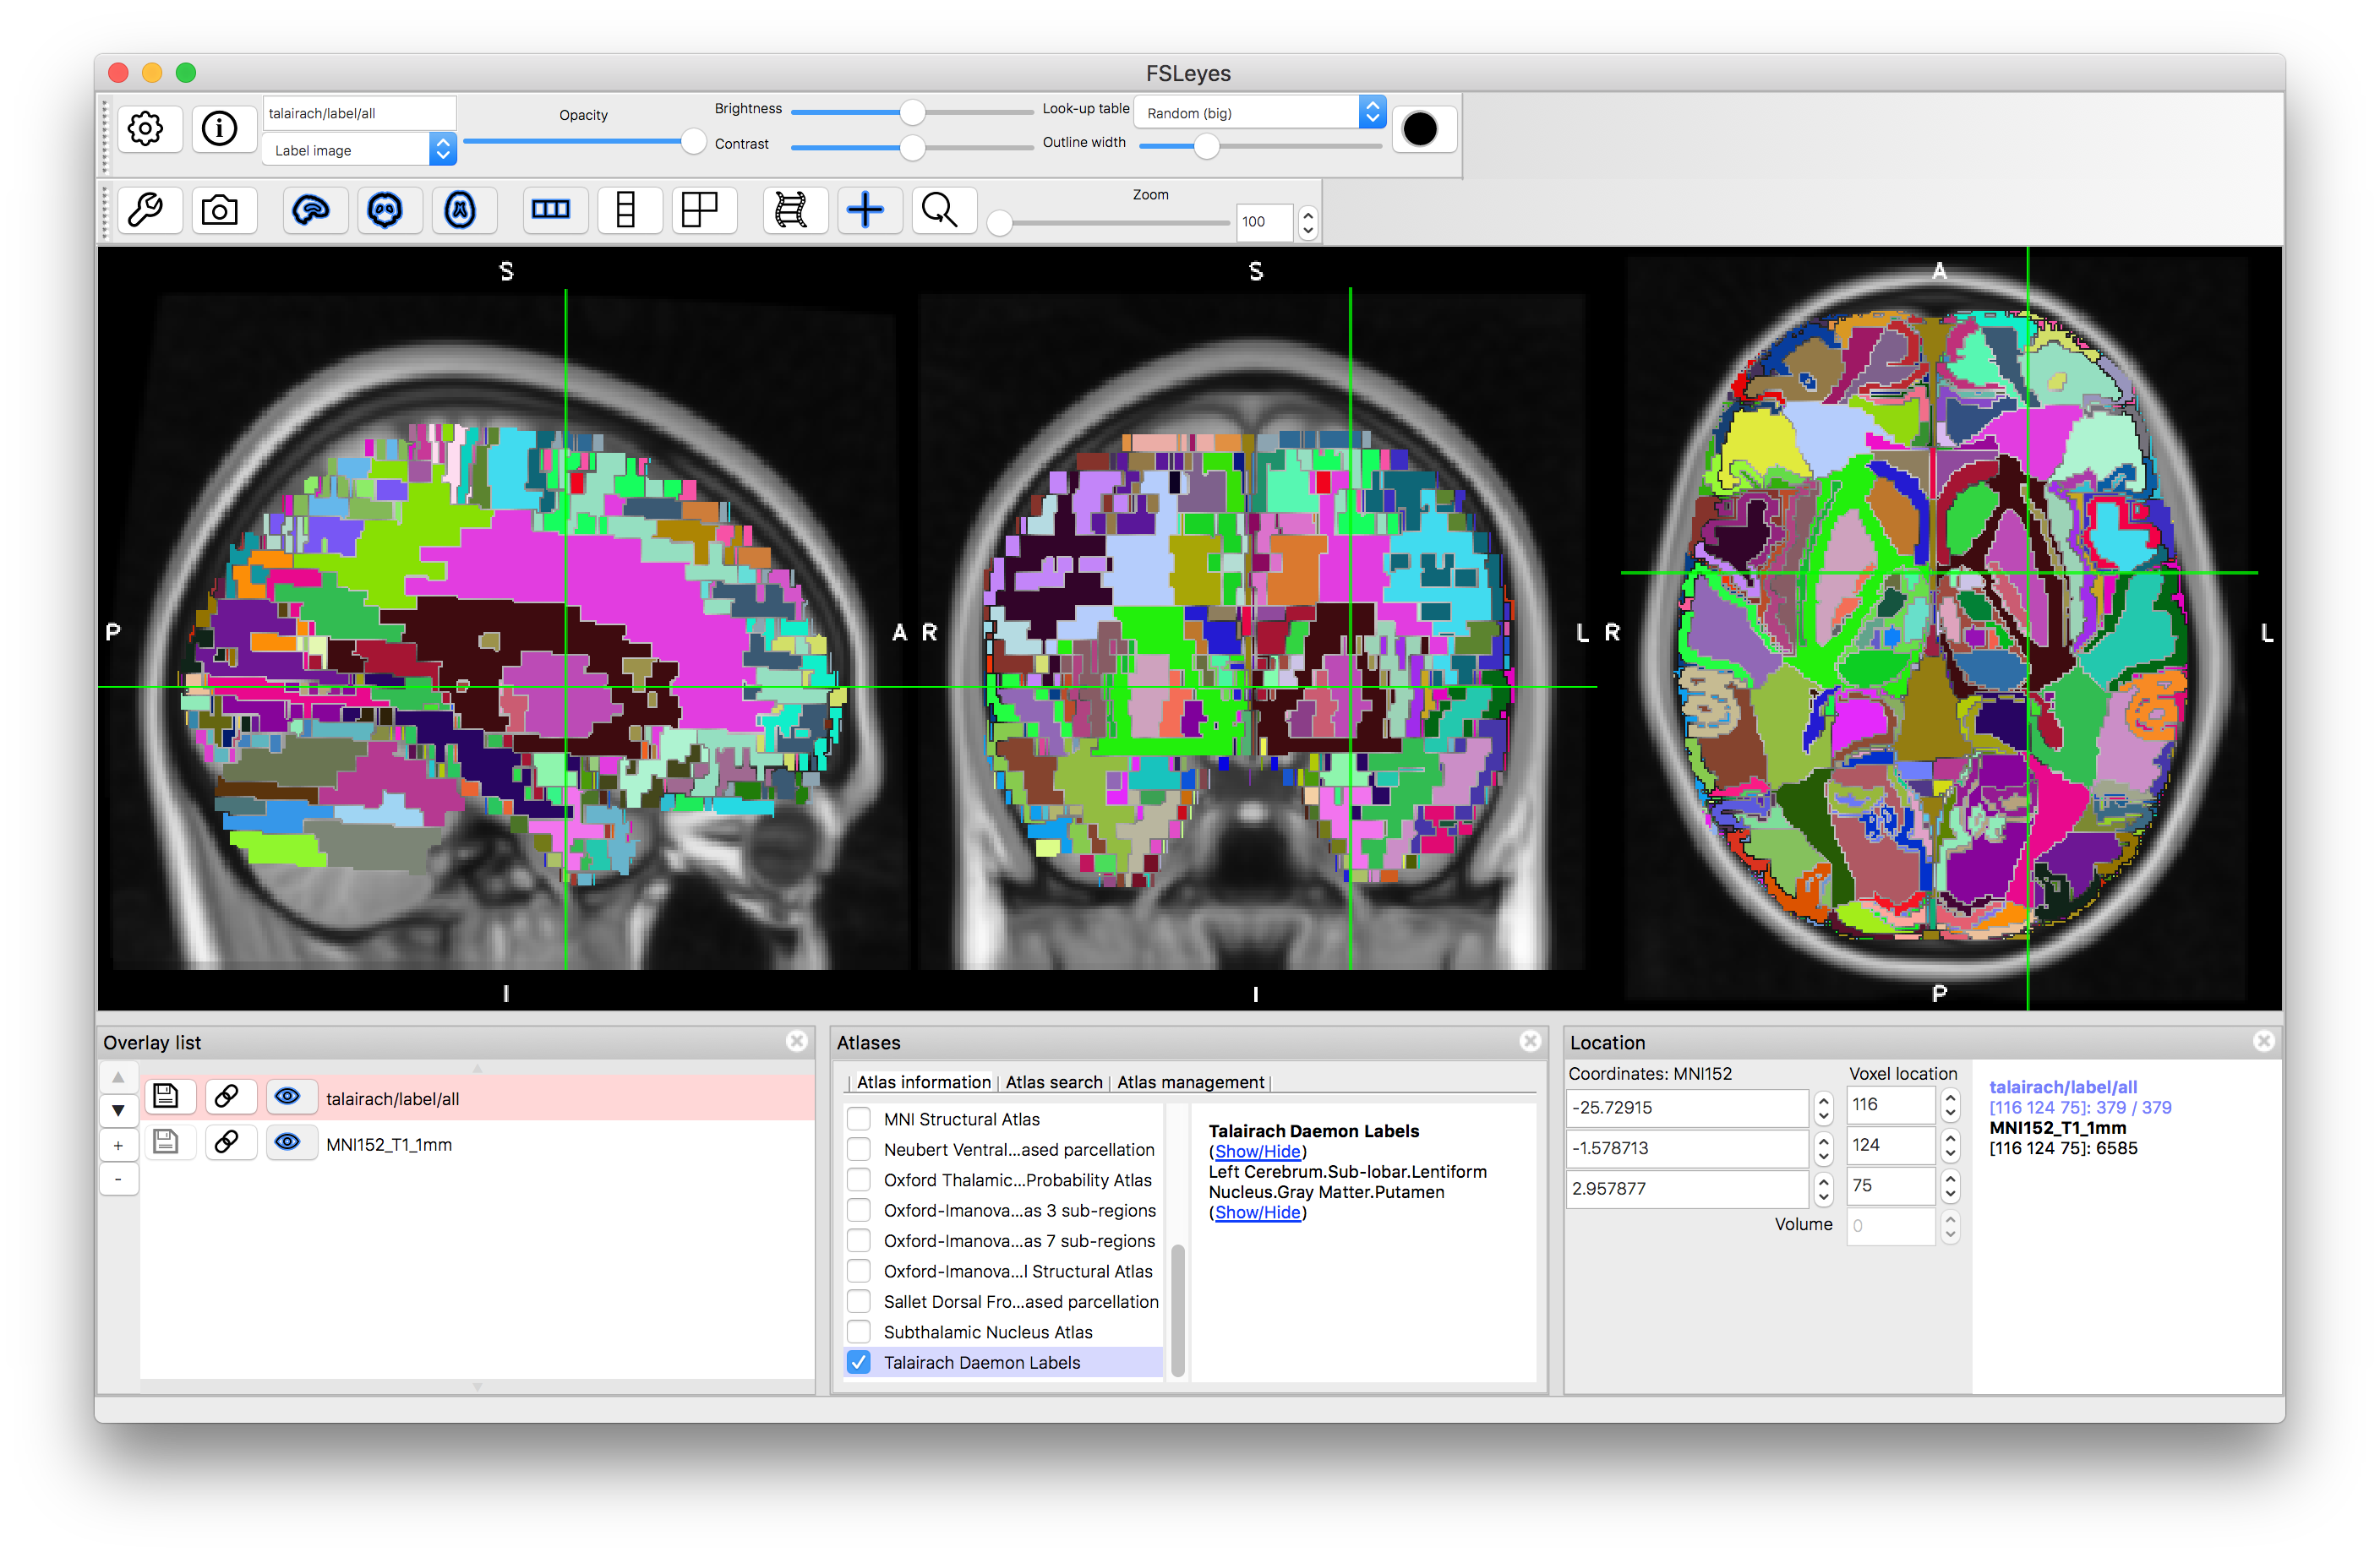
Putamen
These examples, together with the explanation and examples in the Primer text should help you to understand what is available in current digital atlases and how to use them for identifying regions and learning about anatomy. Do try looking at different atlases and see how the information compares, as well as how sharp the various probabilistic borders are, as this strongly reflects the population variation in these structures. You can find out more information about the atlases on the FSL wiki, and especially on the links and references associated with the different atlases.