Example Box: DTI
Introduction
The aim of this example is to look at the results of a diffusion tensor fit and become familiar with the outputs.
This example is based on tools available in FSL, and the file names and instructions are specific to FSL. However, similar analyses can be performed using other neuroimaging software packages.
Please download the dataset for this example here:
Data download
The dataset you downloaded contains the following files:
- Pre-processed diffusion data:
data.nii.gz - Brain mask:
nodif_brain_mask.nii.gz - Text files specifying the b-values and diffusion encoding directions:
bvalsandbvecs - A directory of results:
DTIFITresults
Viewing the Scalar Data
To start with load the pre-processed diffusion data data.nii.gz into a viewer (e.g. fsleyes) and inspect this. It is actually the same data from the previous example box, which is fully corrected for distortions due to B0 inhomogeneities and eddy-currents as well as subject motion.
Calculating the diffusion tensor fit and related quantities is very straightforward given this data and the associated files (brain mask image plus b-value and direction information). The results of this are already provided here, in the directory DTIFITresults, but you can easily calculate these yourself in the following way:
- Start the main FSL GUI by typing
fsl &in a terminal. - Select the FDT tool
- In the new FDT GUI, use the top pull down menu to select the "DTIFIT" option
- Use the file browser to select the directory containing the
data.nii.gzfile - Press "Go"
- Wait for a popup box telling you it is finished, or monitor the progress in the terminal window.
The results of this (in DTIFITresults if you did not run it yourself) are the image files:
dti_FA.nii.gz
dti_L1.nii.gz
dti_L2.nii.gz
dti_L3.nii.gz
dti_MD.nii.gz
dti_MO.nii.gz
dti_S0.nii.gz
dti_V1.nii.gz
dti_V2.nii.gz
dti_V3.nii.gz
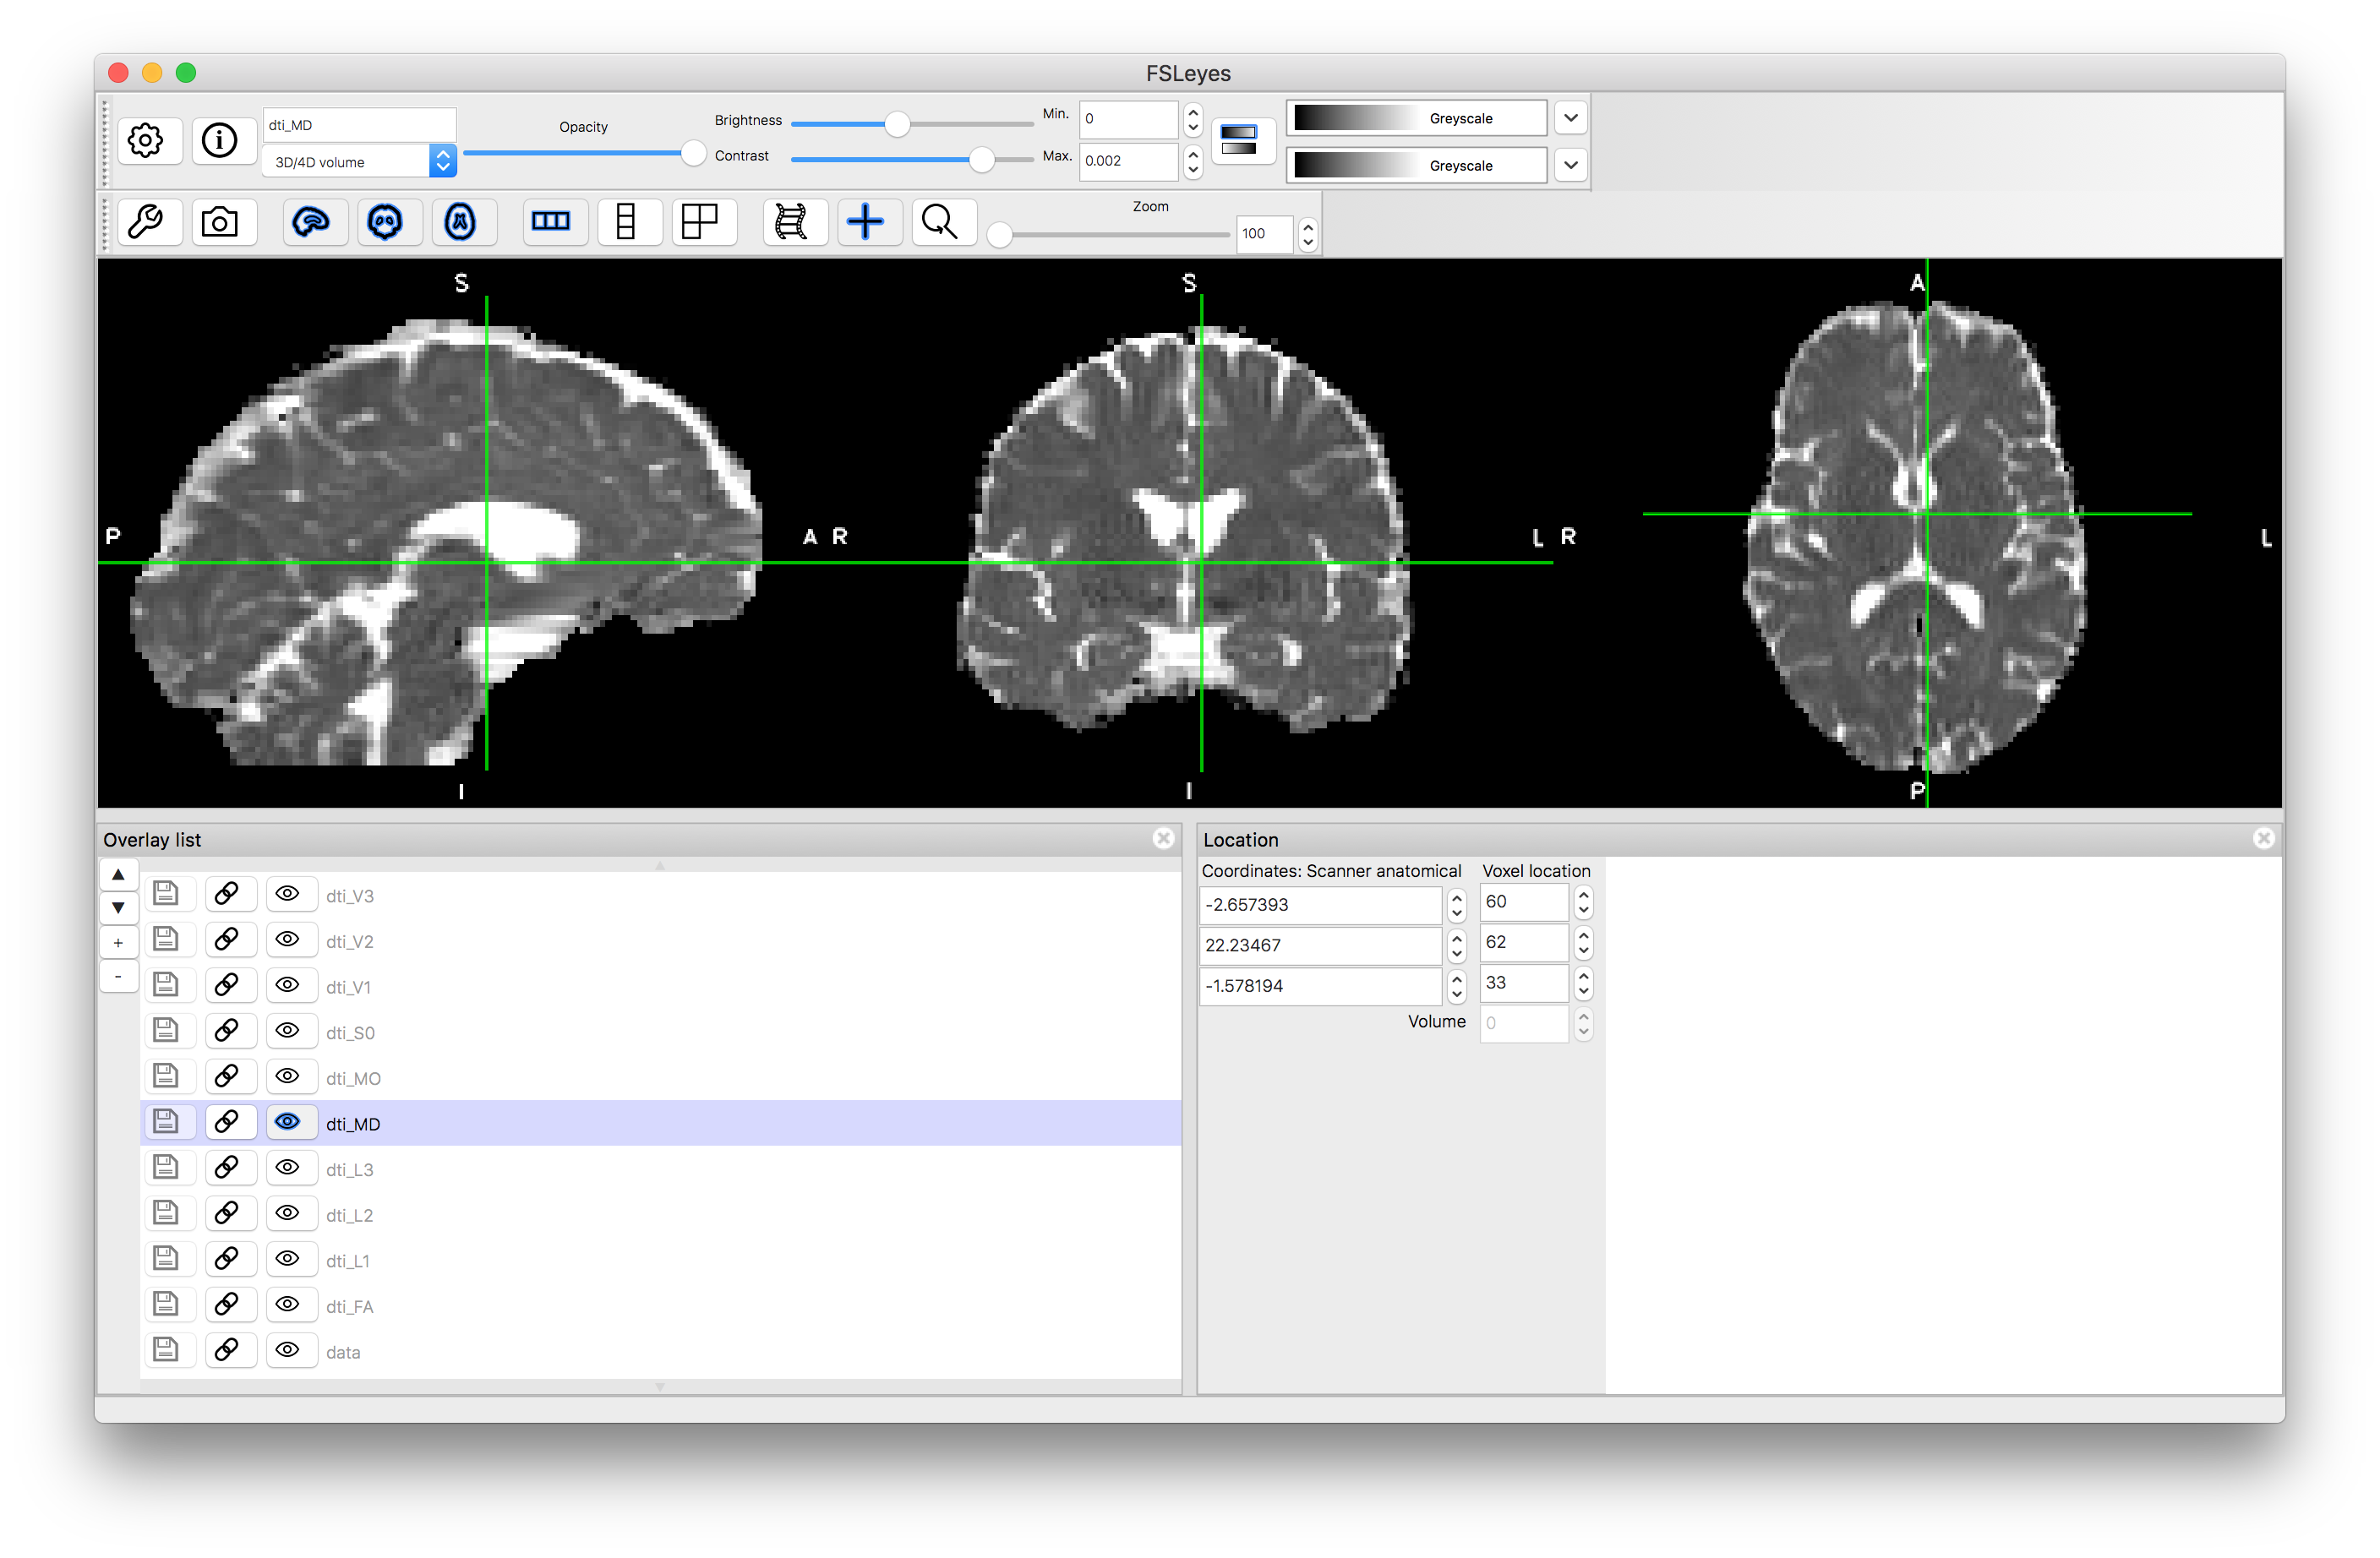
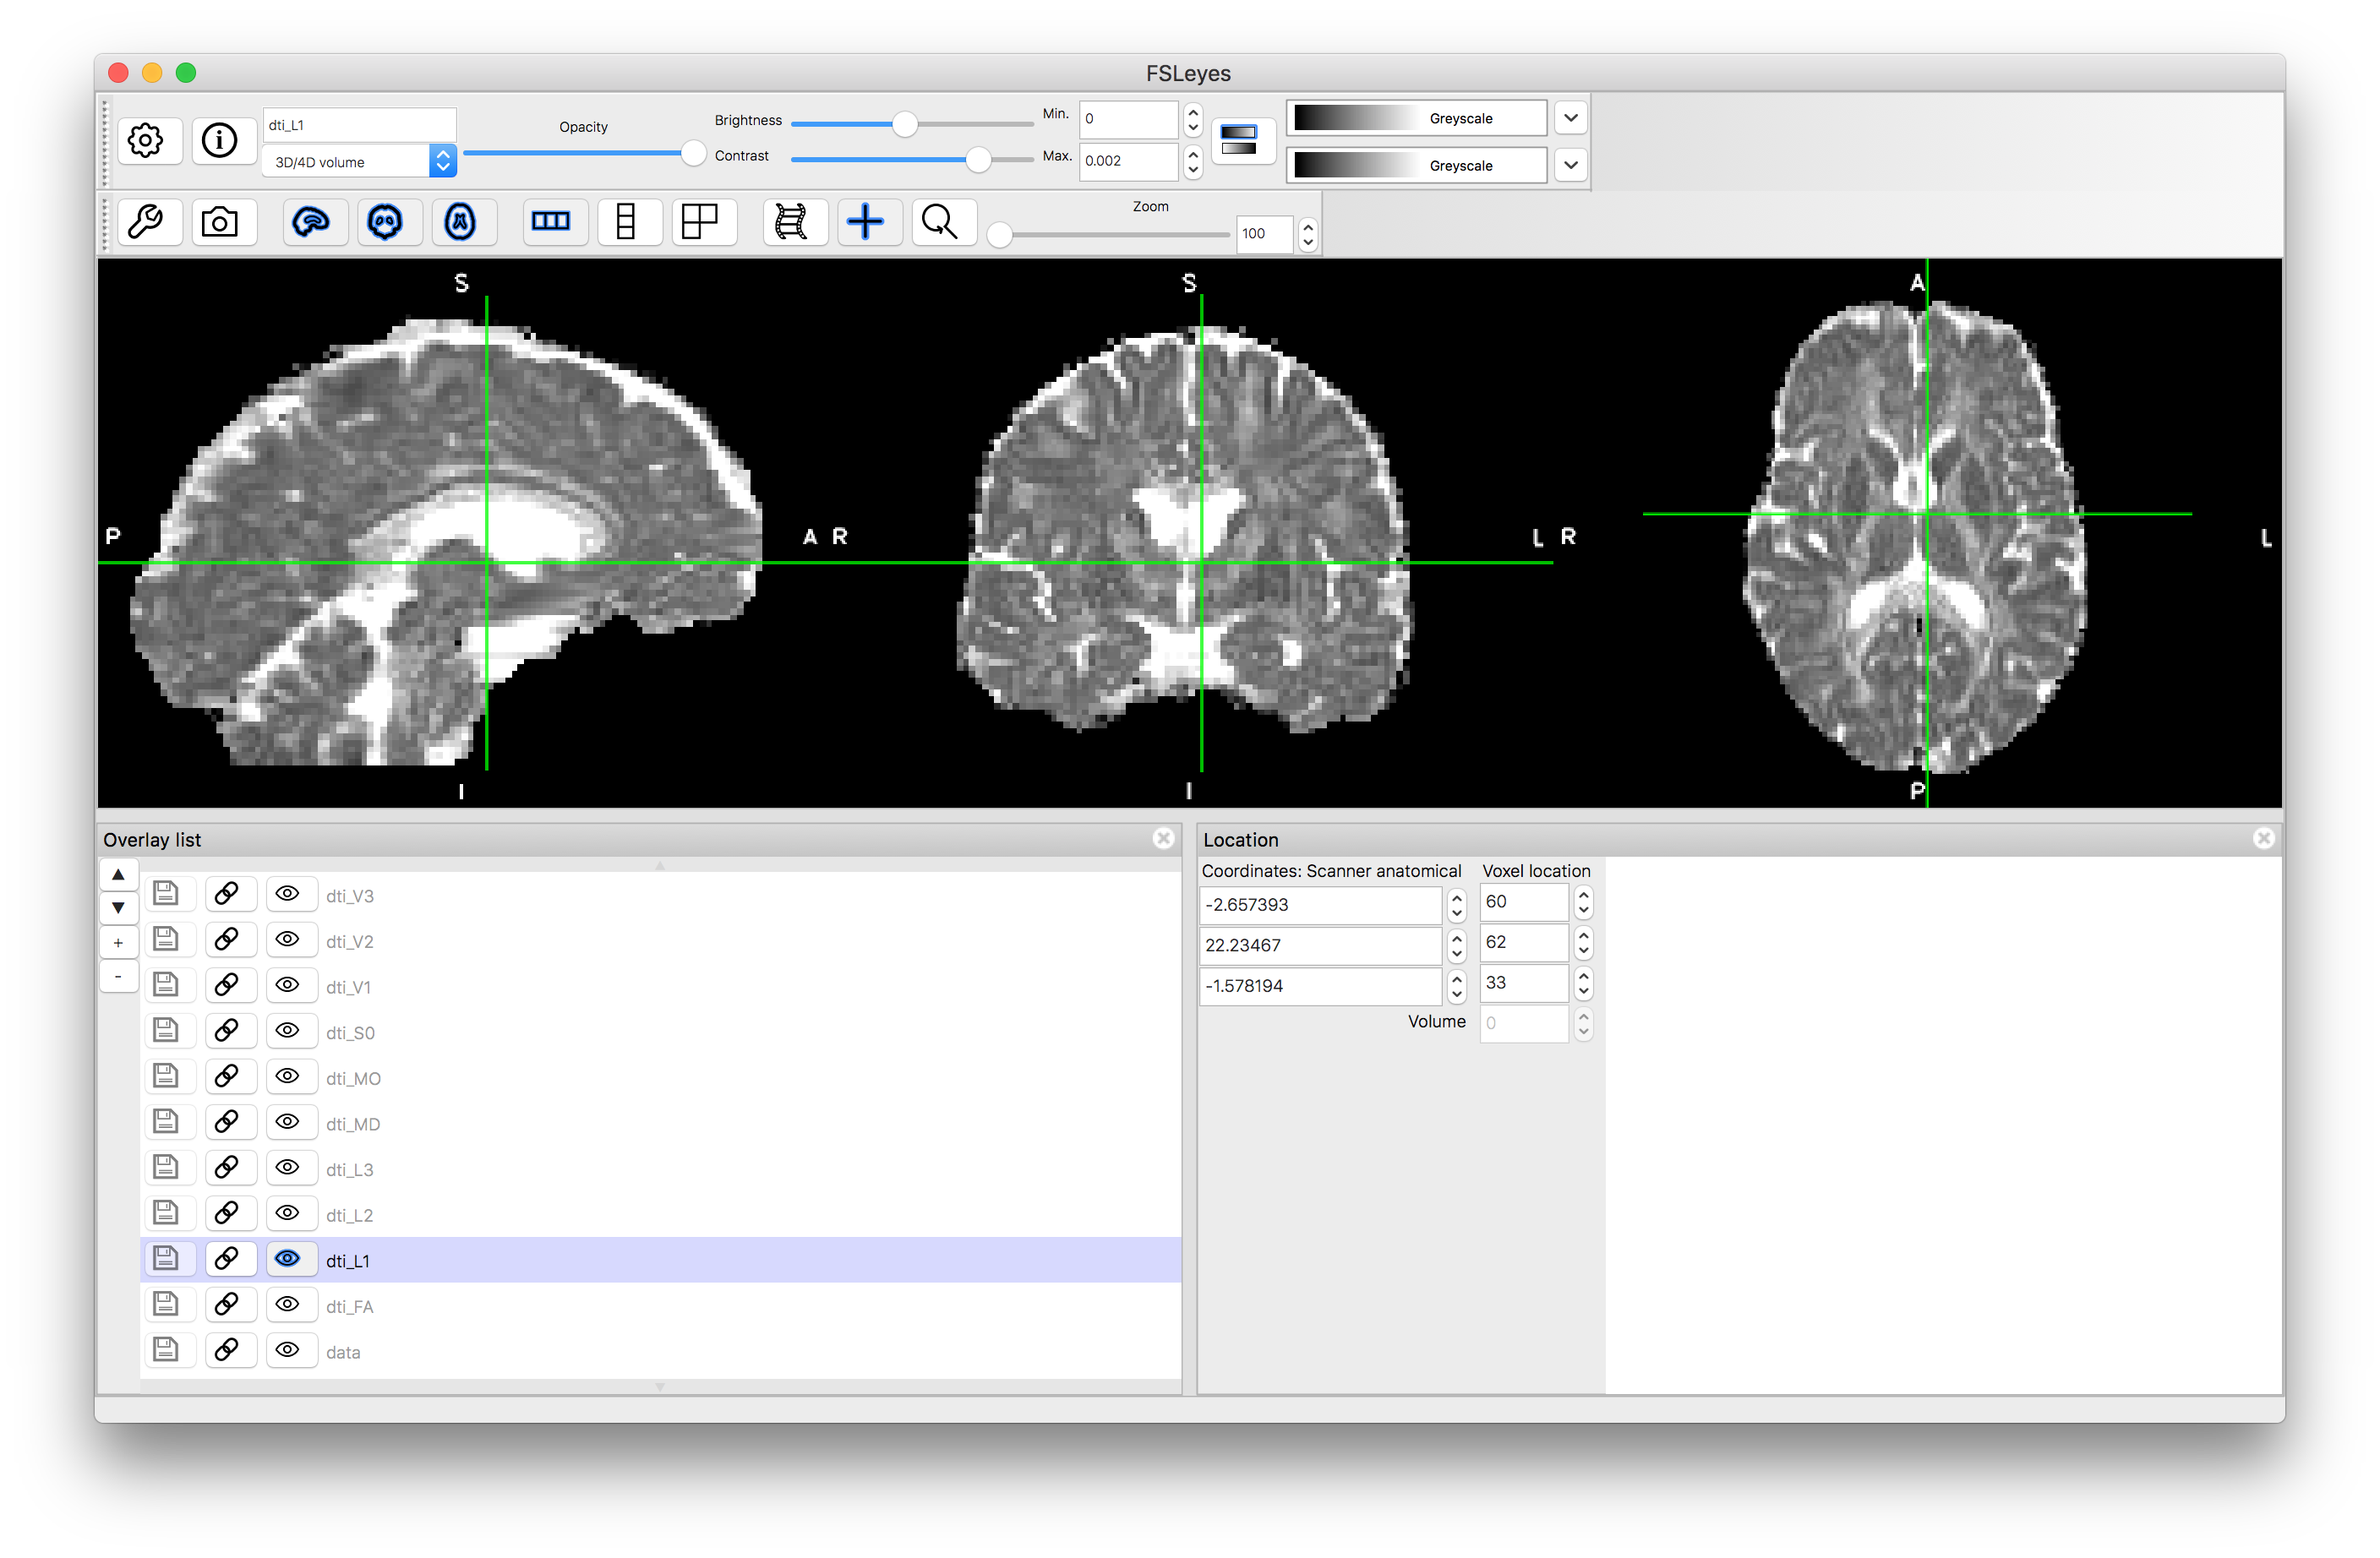
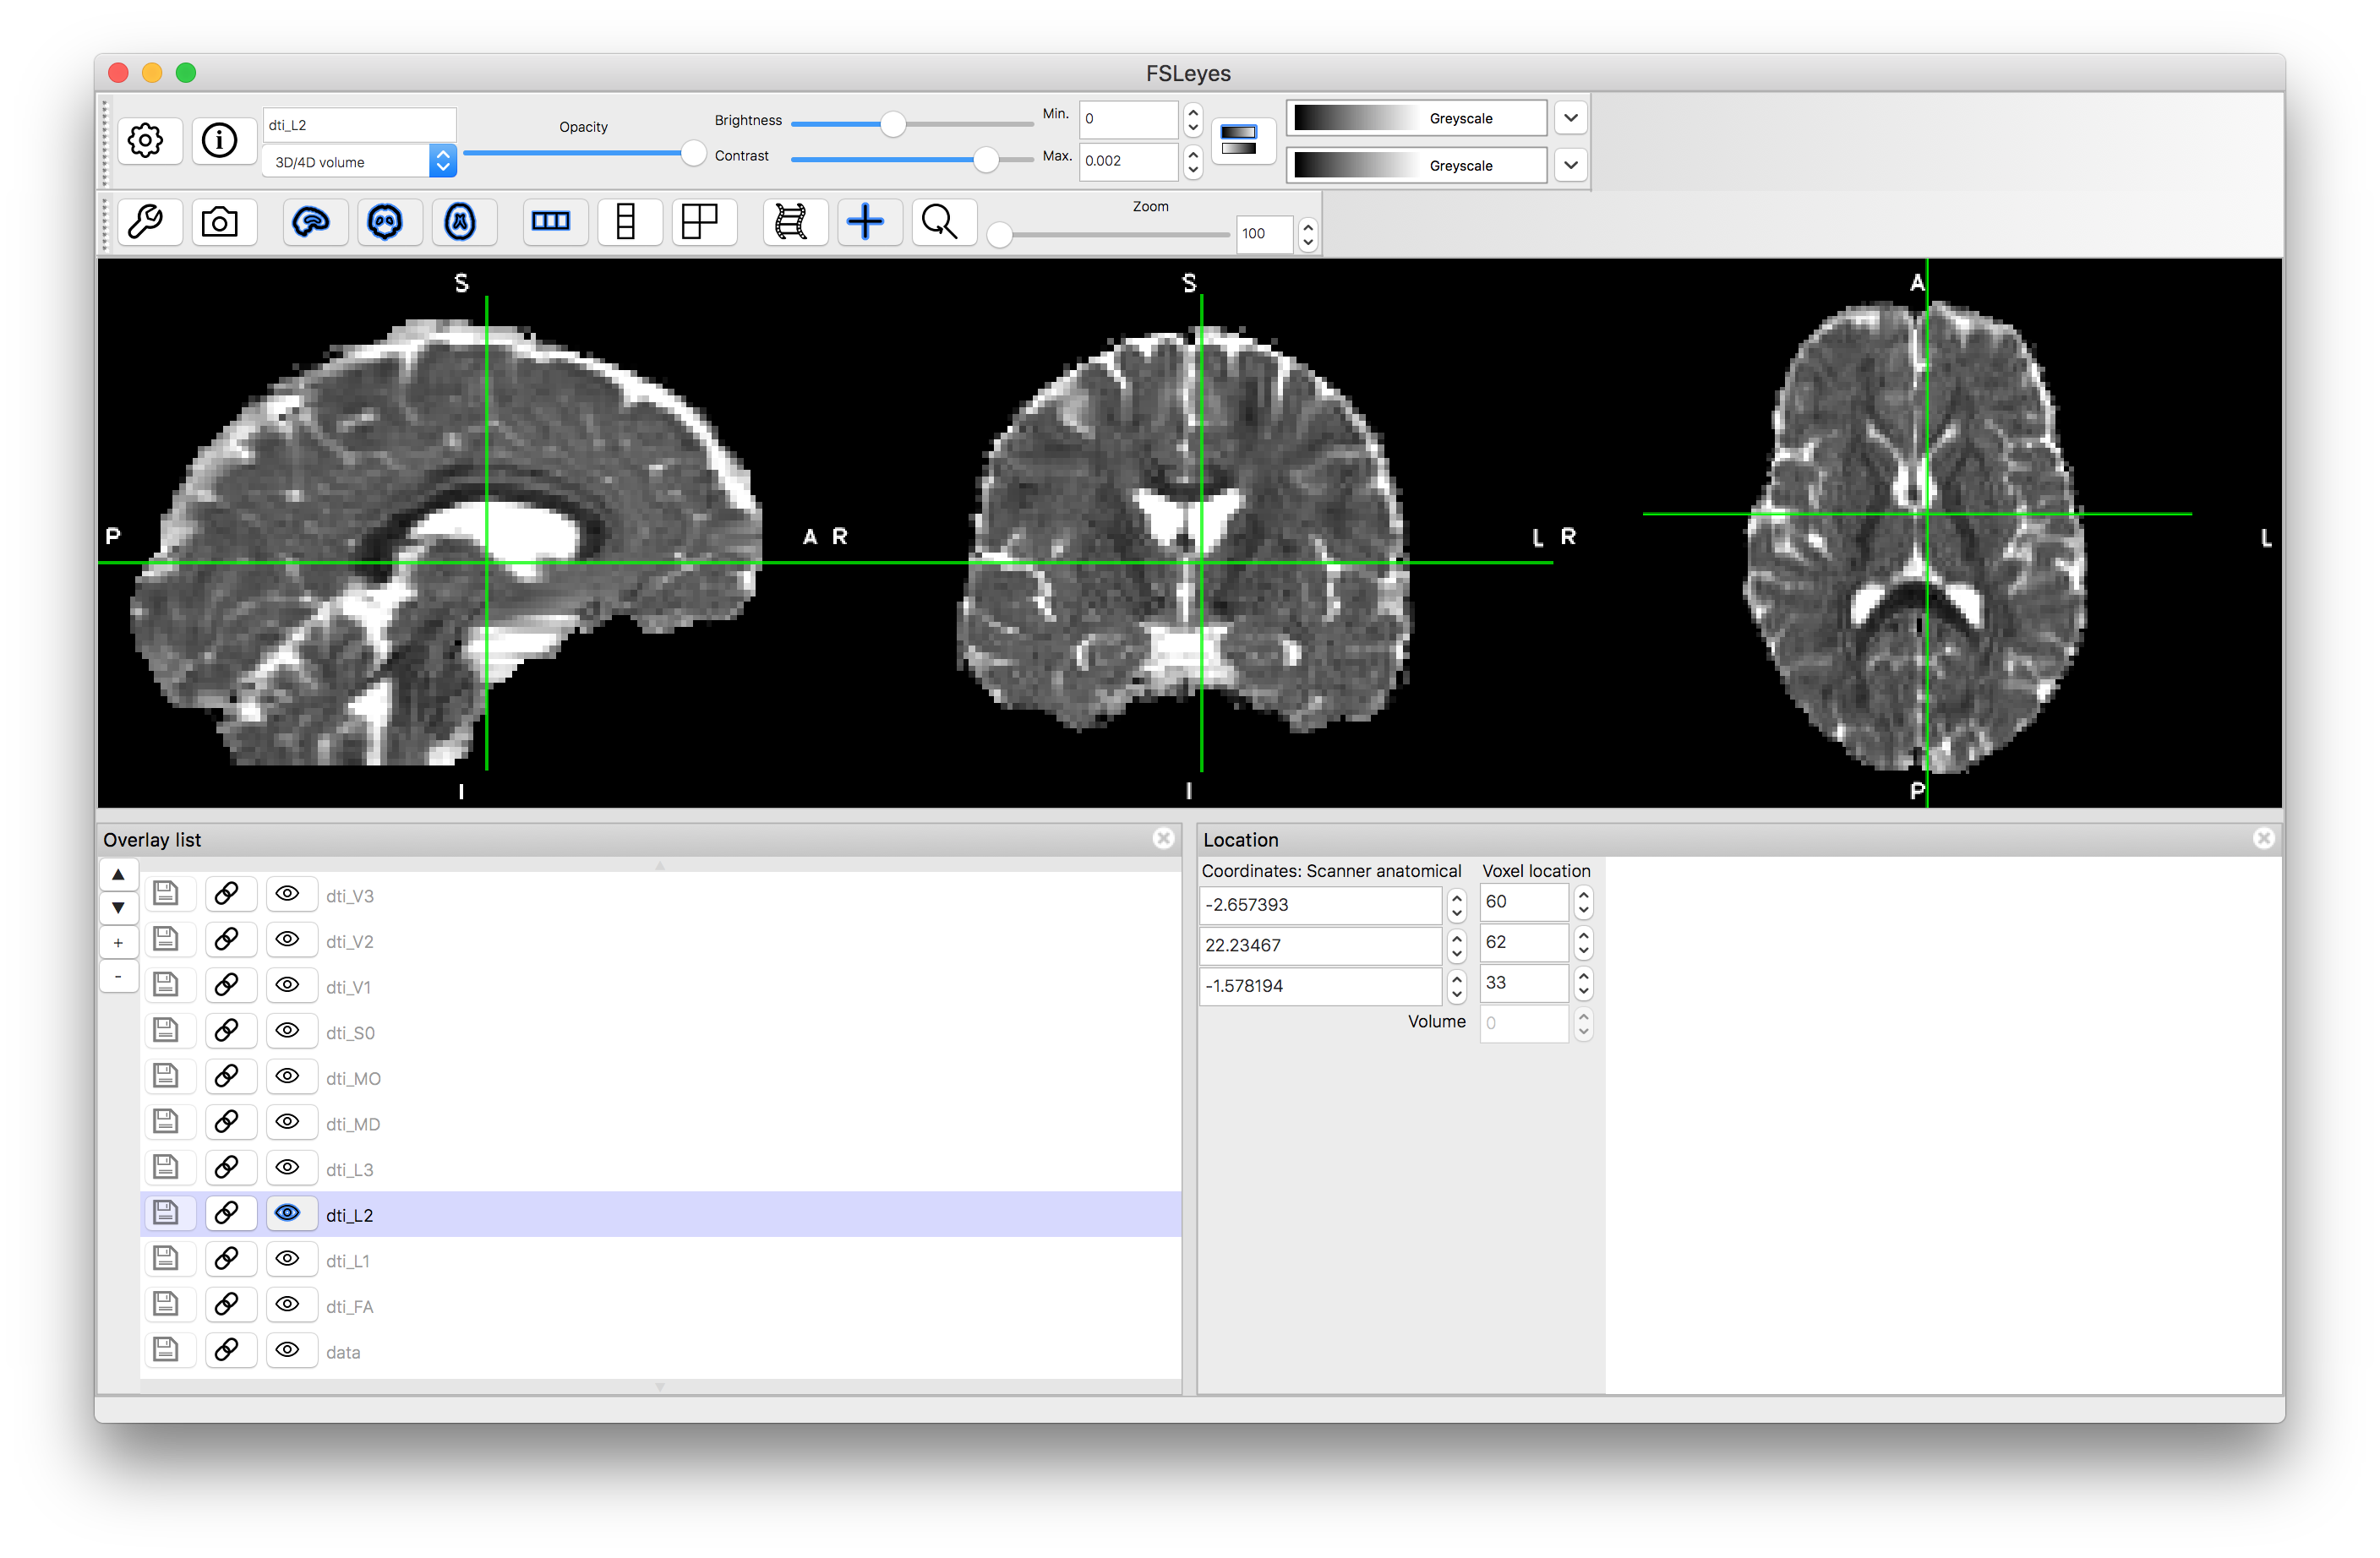
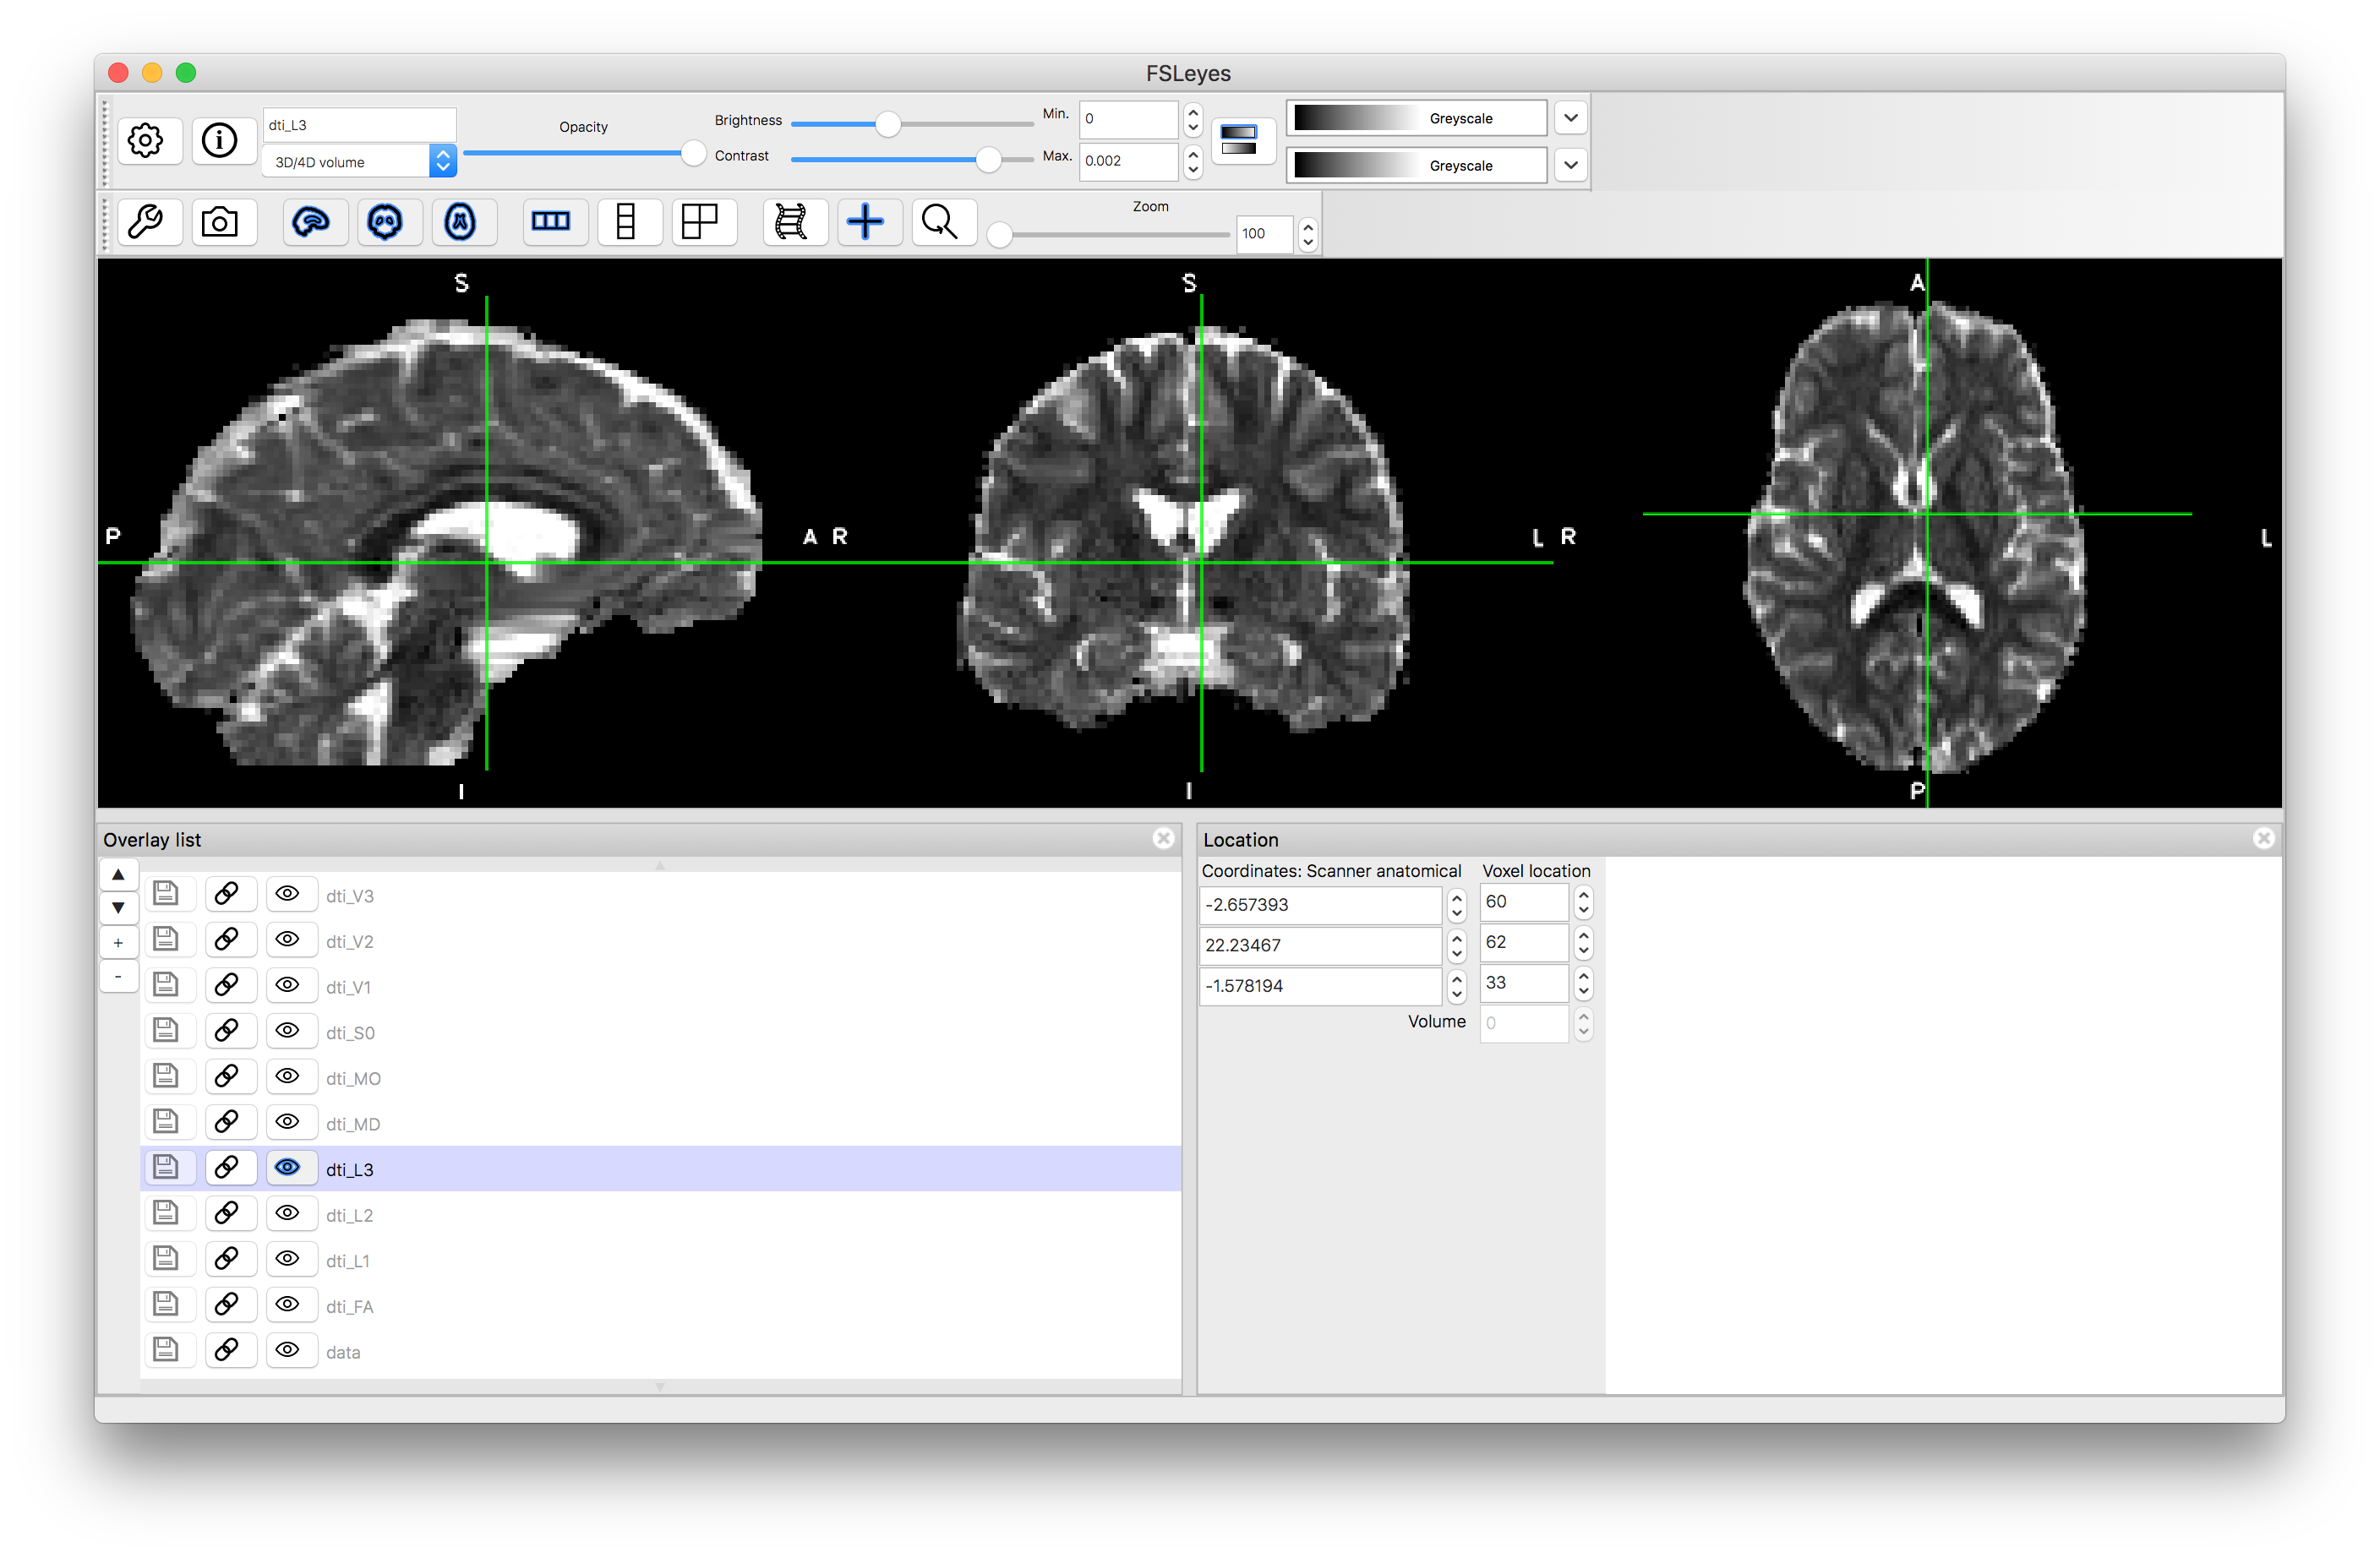
These represent the main results from a diffusion tensor fit, where L1, L2, L3 represent the amount of diffusion along the three principal directions and V1, V2, V3 represent the (unit) vectors for these directions. The S0 output represents the estimate of the signal prior to any diffusion encoding. The remaining outputs are: MO, which represents the mode; MD, which represents the mean diffusivity; and FA, which represents the fractional anisotropy. The last two are the most commonly used diffusion tensor quantities.
Load each of these into the viewer to see what they look like. Useful display ranges for these data are: 0 to 0.002 for L1, L2, L3, MD; 0 to 1 for FA; and -1 to +1 for MO. Values for S0 will be similar to those in the original data and we will consider viewing the vectors separately. The images should look something like this:
FA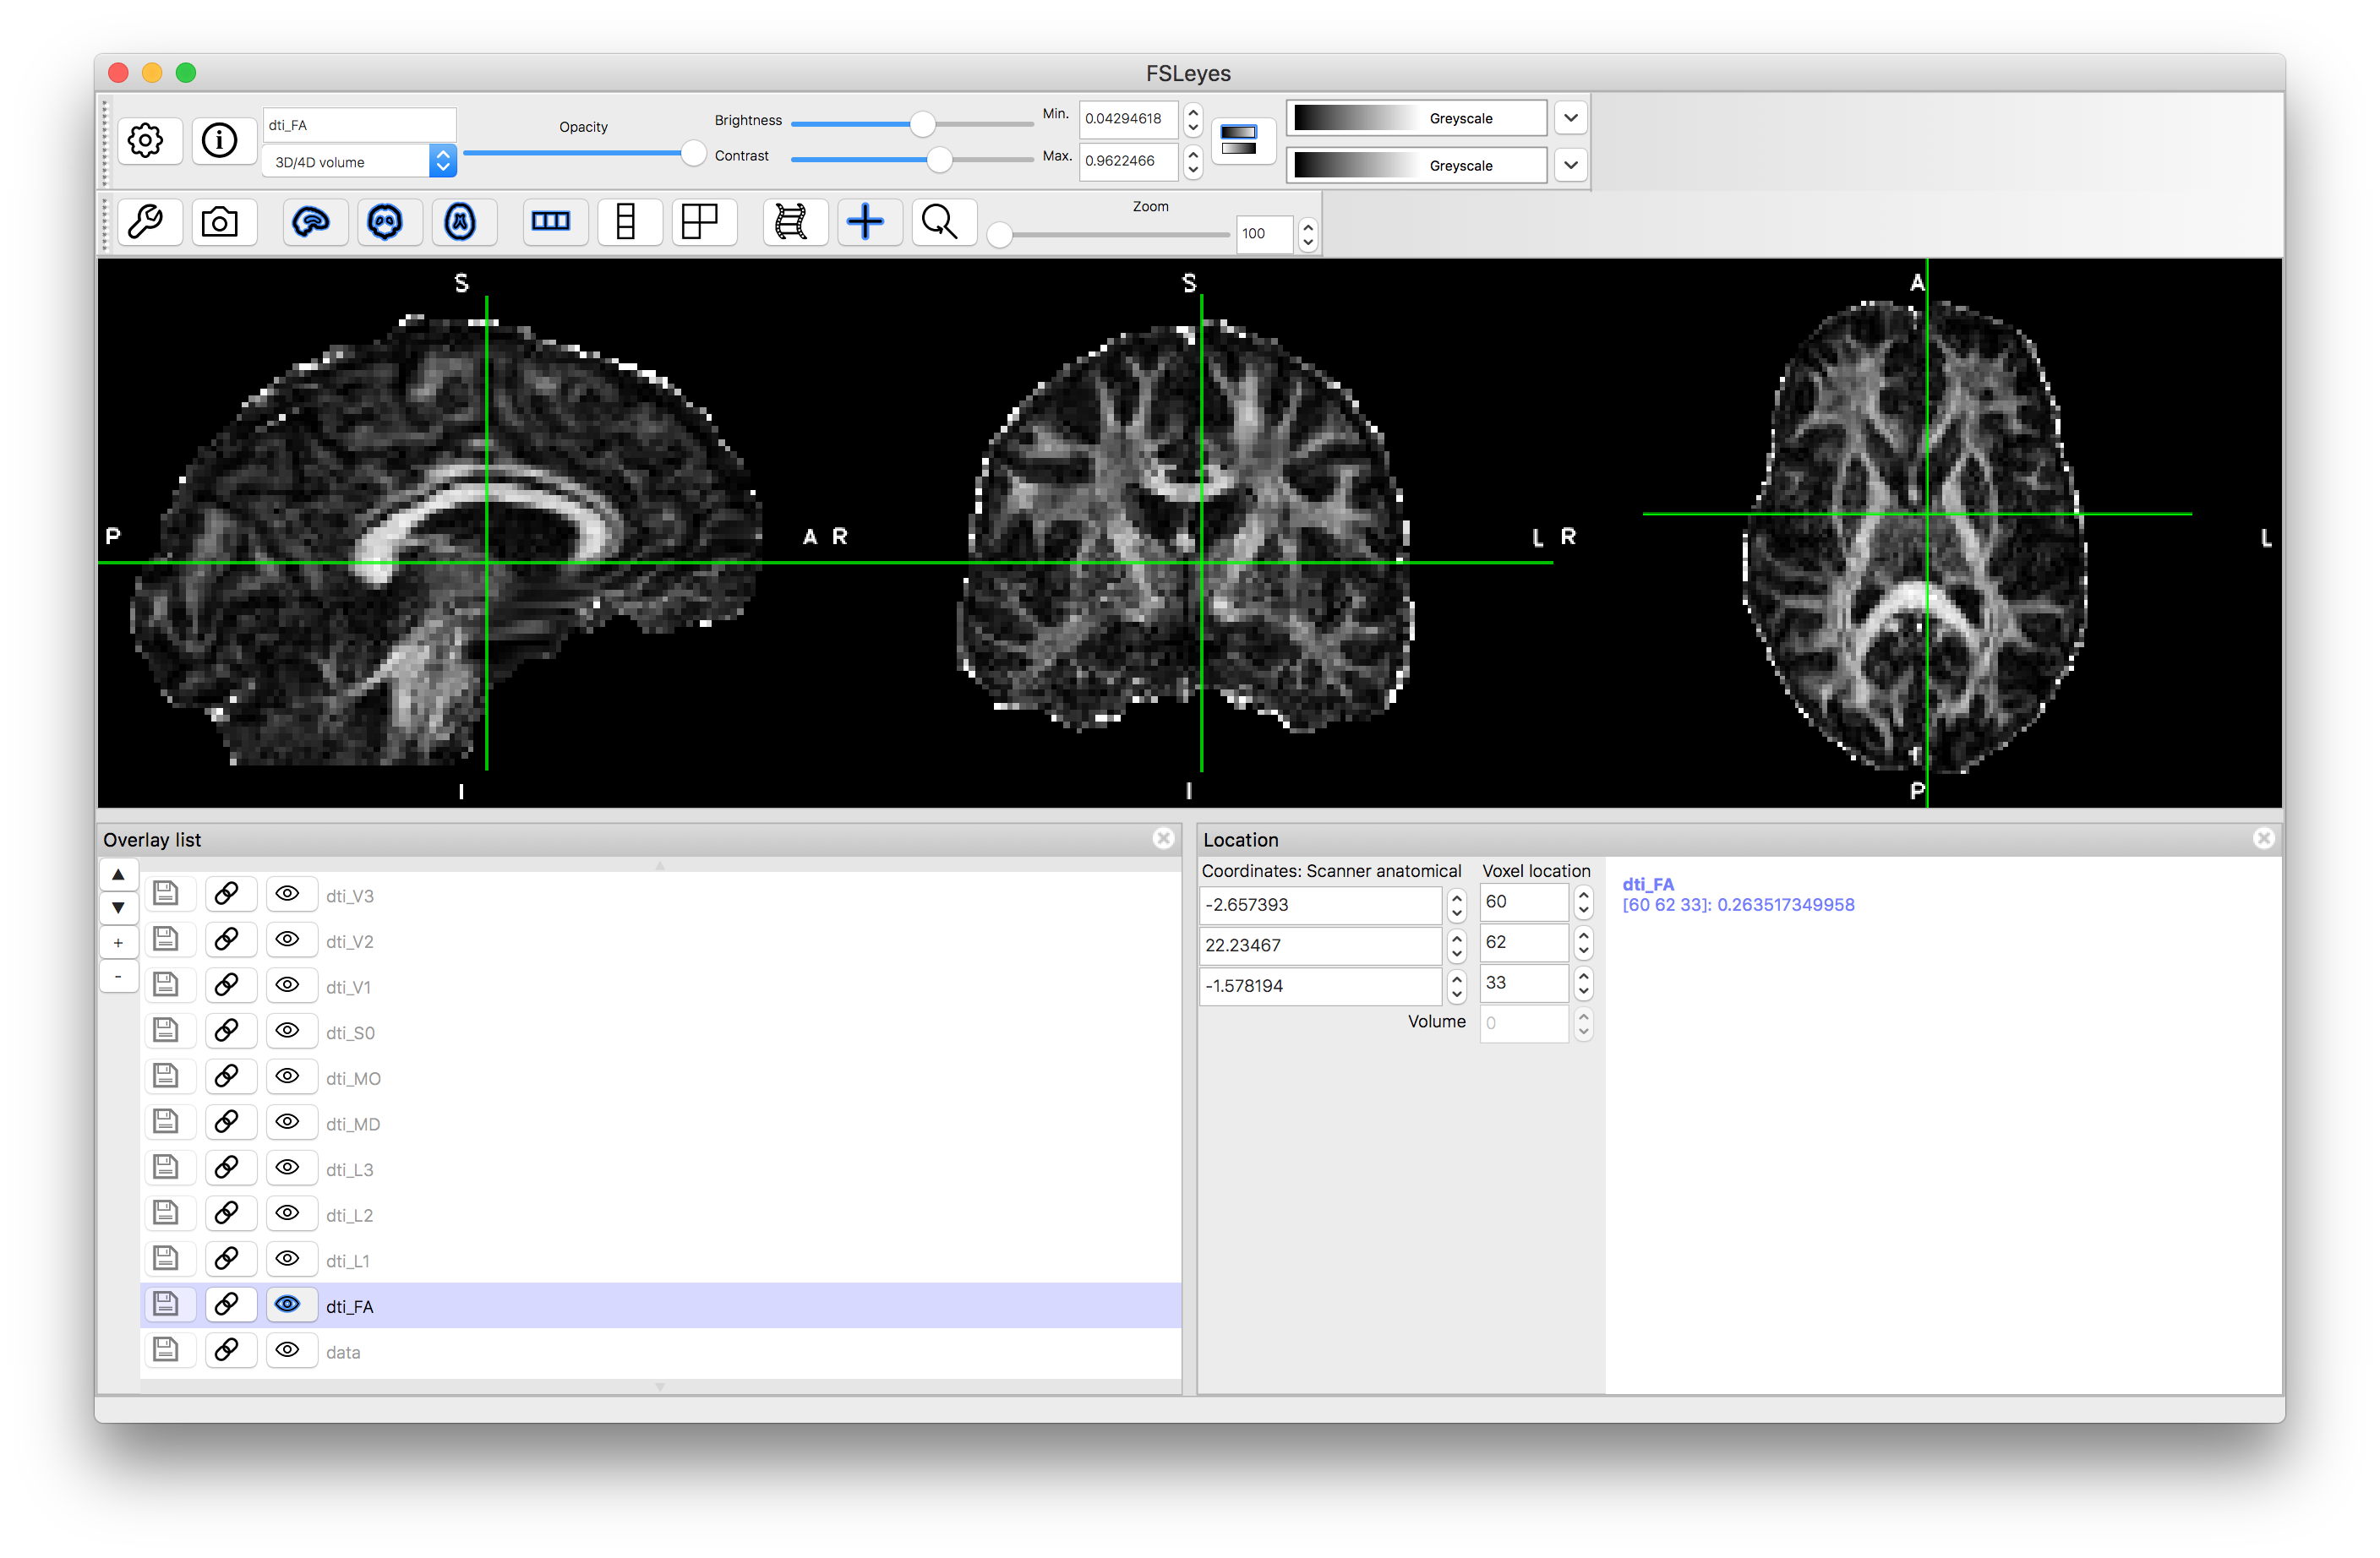
MD
L1
L2
L3
MO
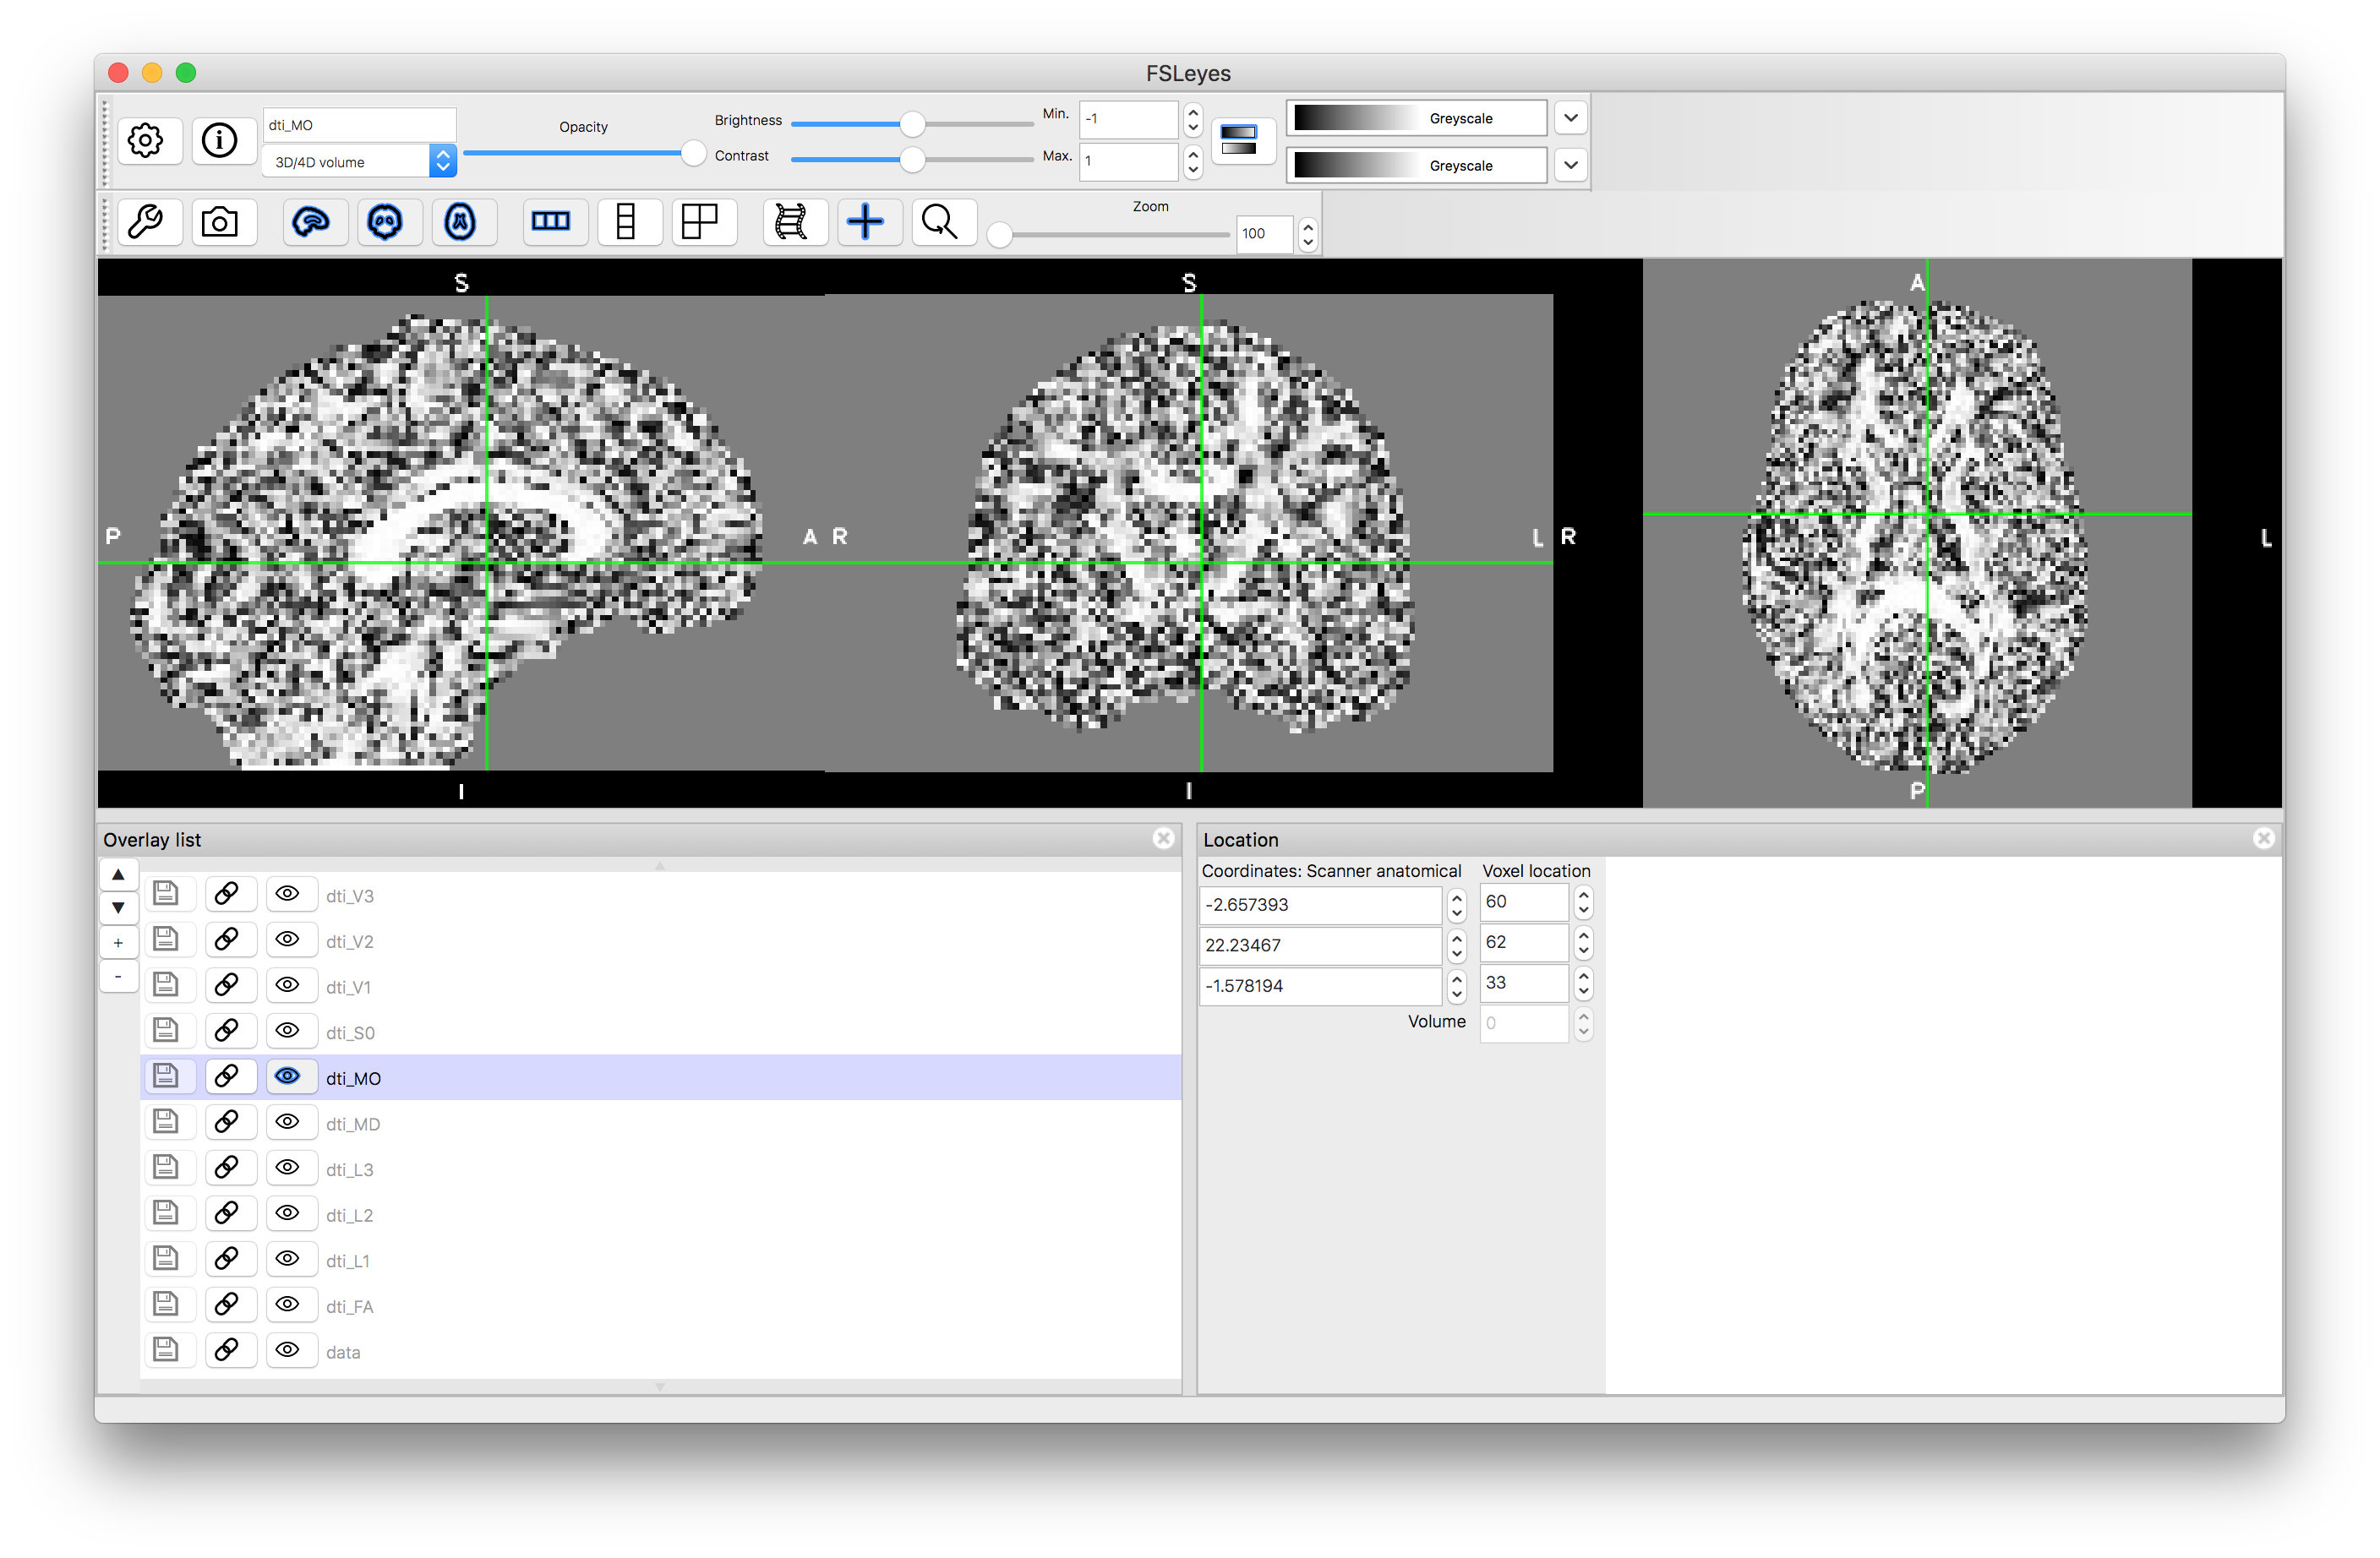
Note how the FA is high in the white matter, whilst MD is similar in white matter and gray matter. The mode, MO, is a very noisy measure outside of the white matter. The diffusion along the principal directions is highest for L1 and least for L3, demonstrating the contribution and how isotropic or anisotropic the diffusion is: i.e., areas of isotropic diffusion have similar values in L1, L2 and L3 and low FA, while areas of anisotropic diffusion have very different values in L1, L2 and L3 and have high FA.
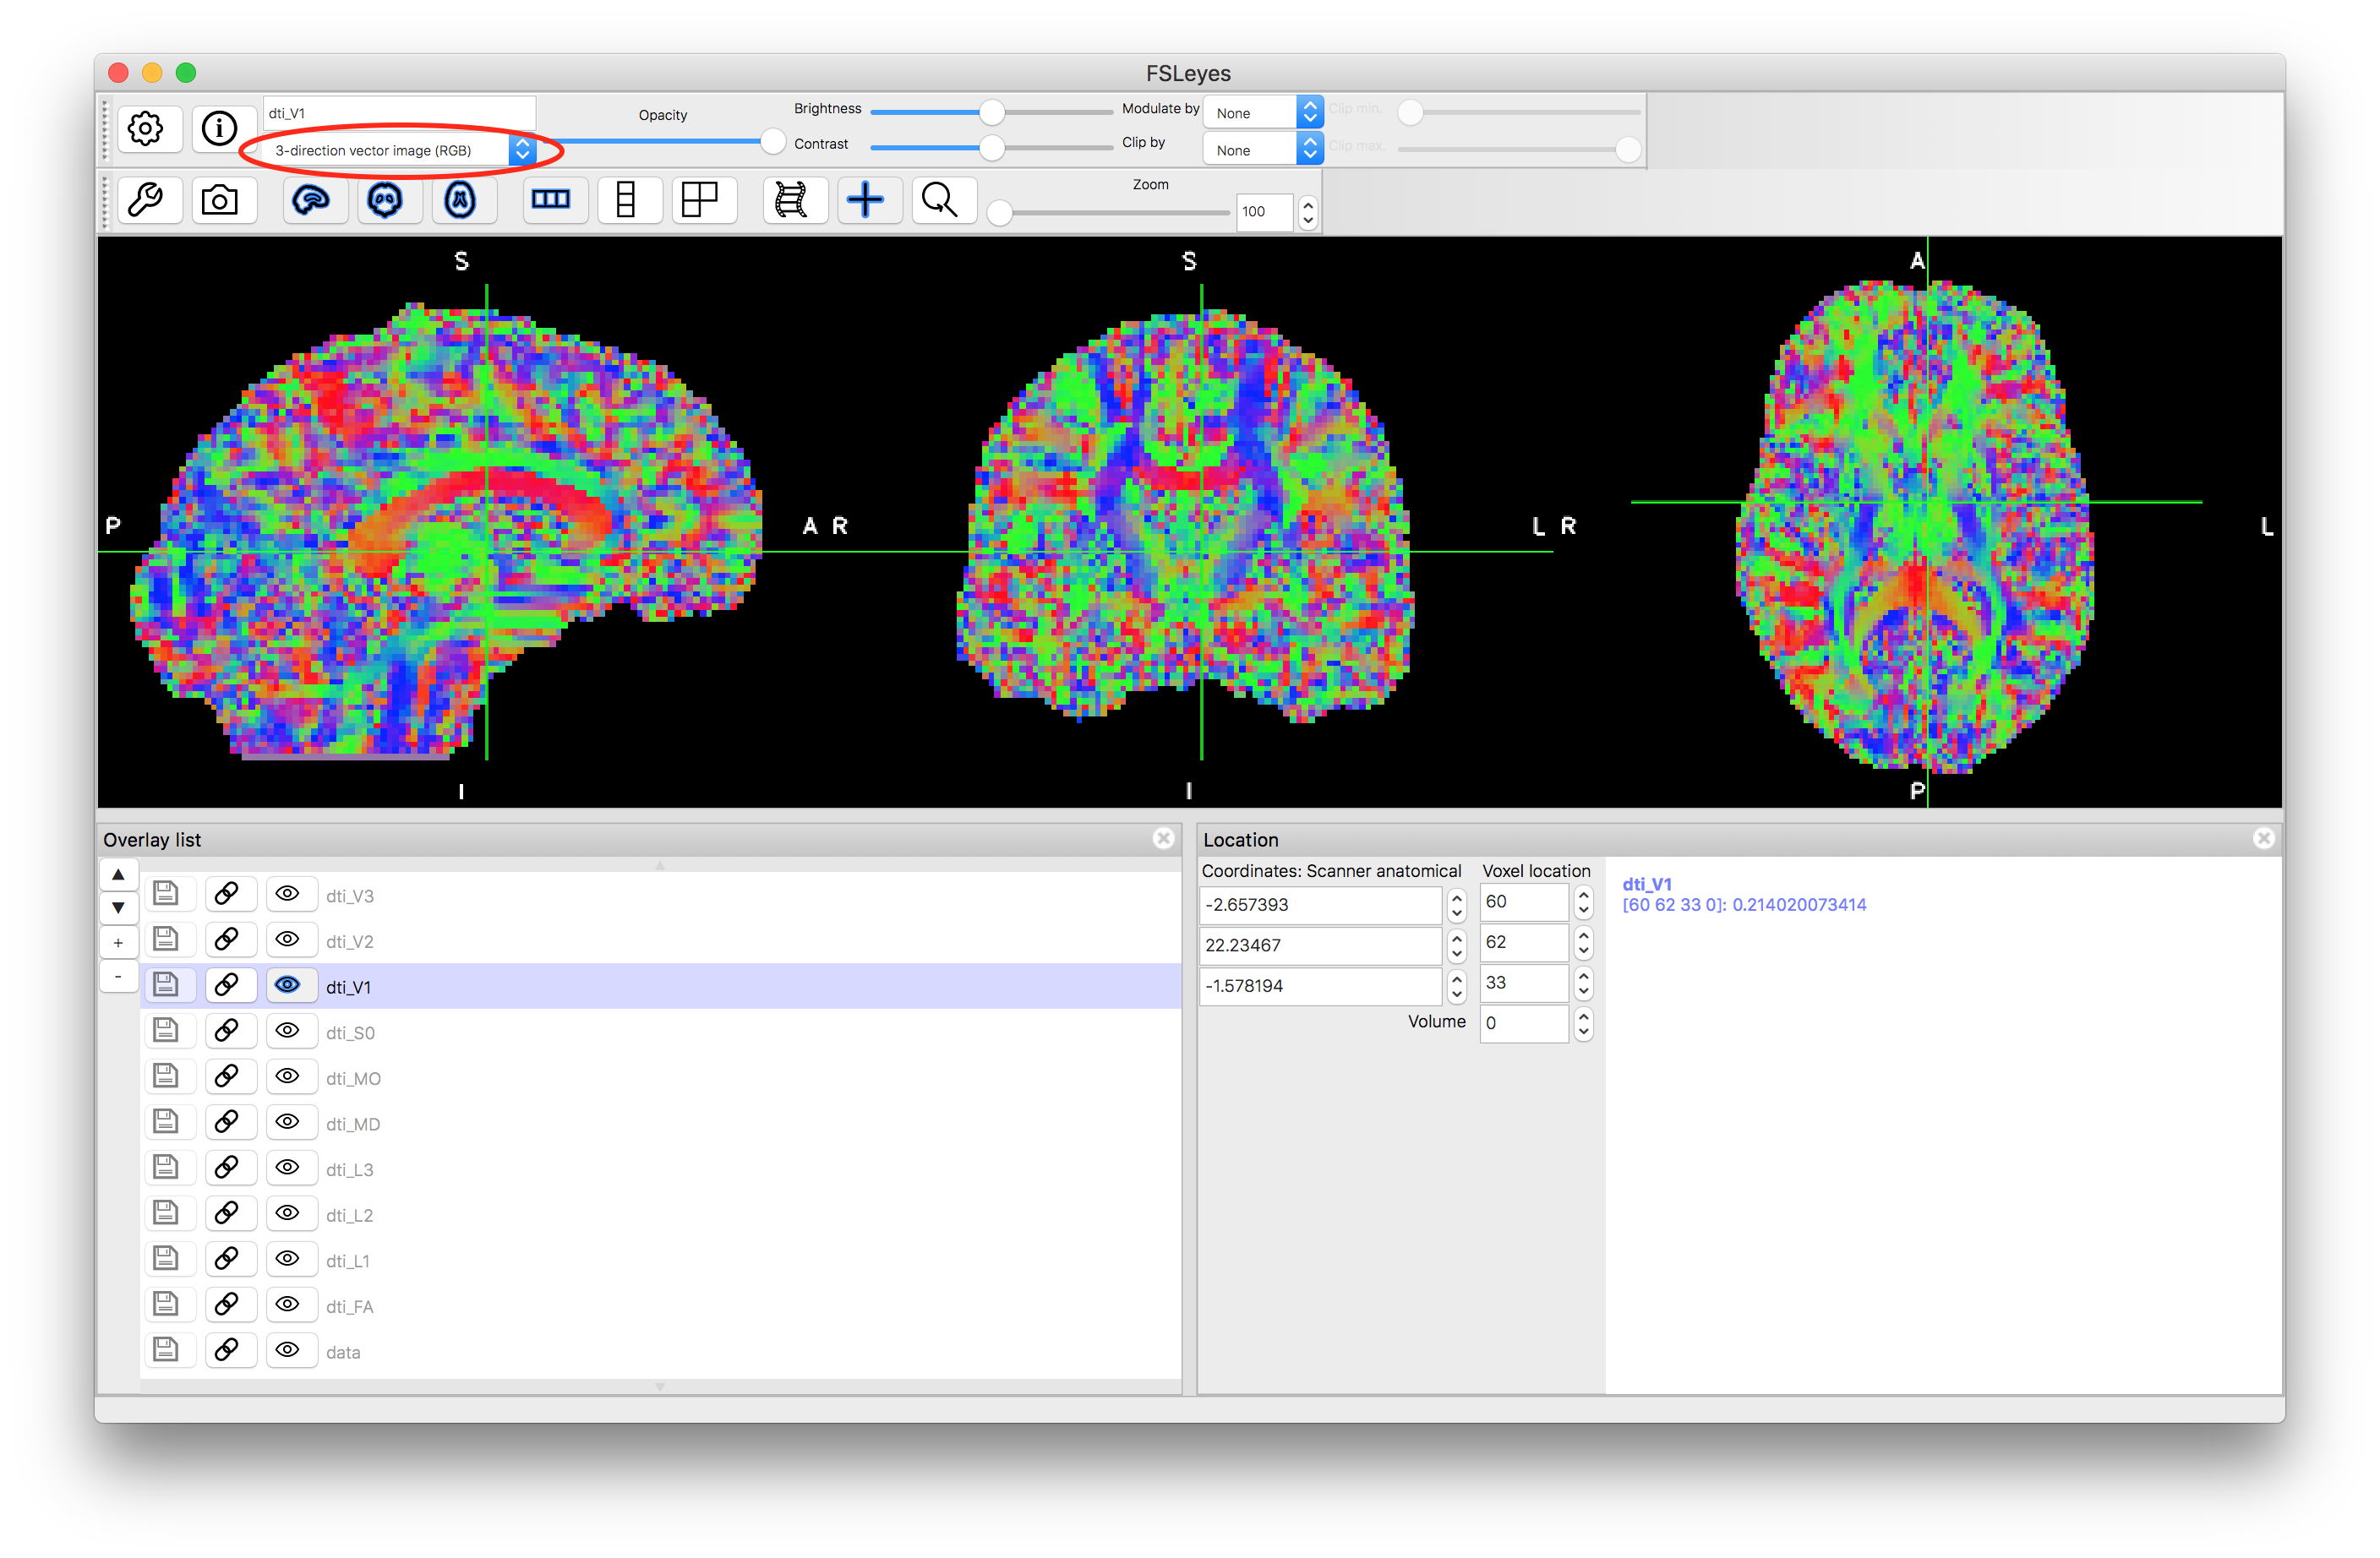
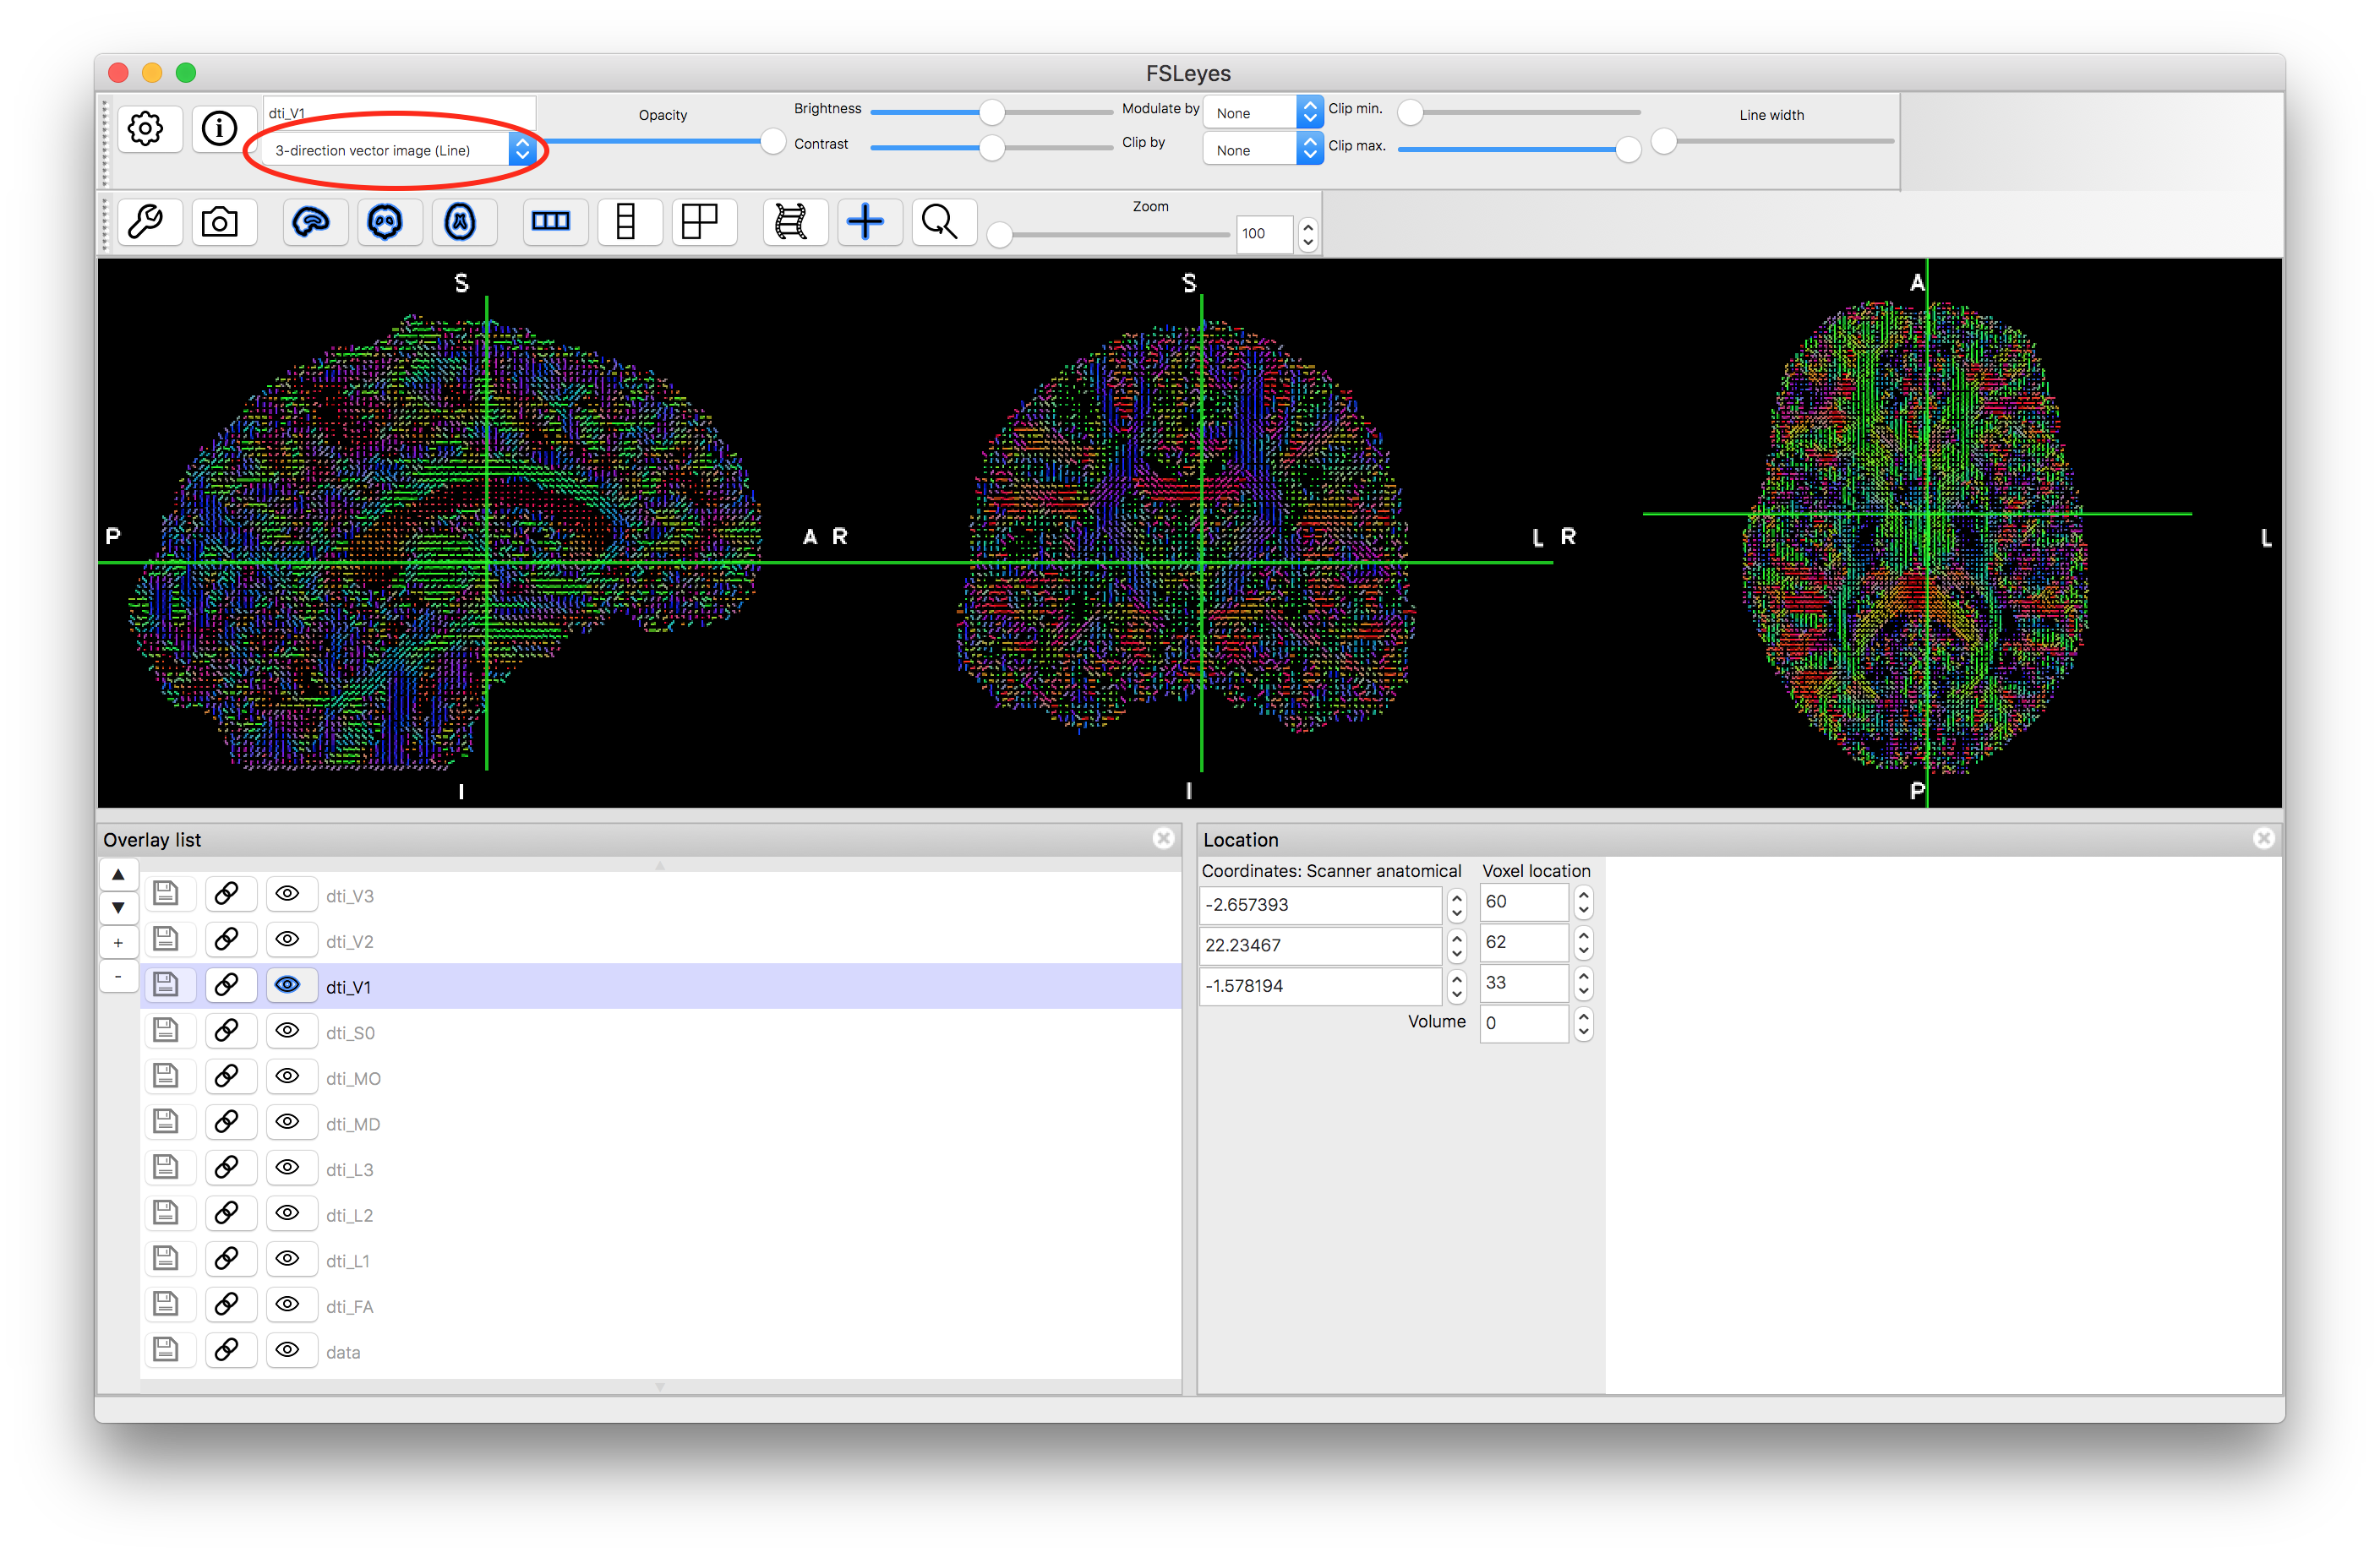
Viewing Vector Data
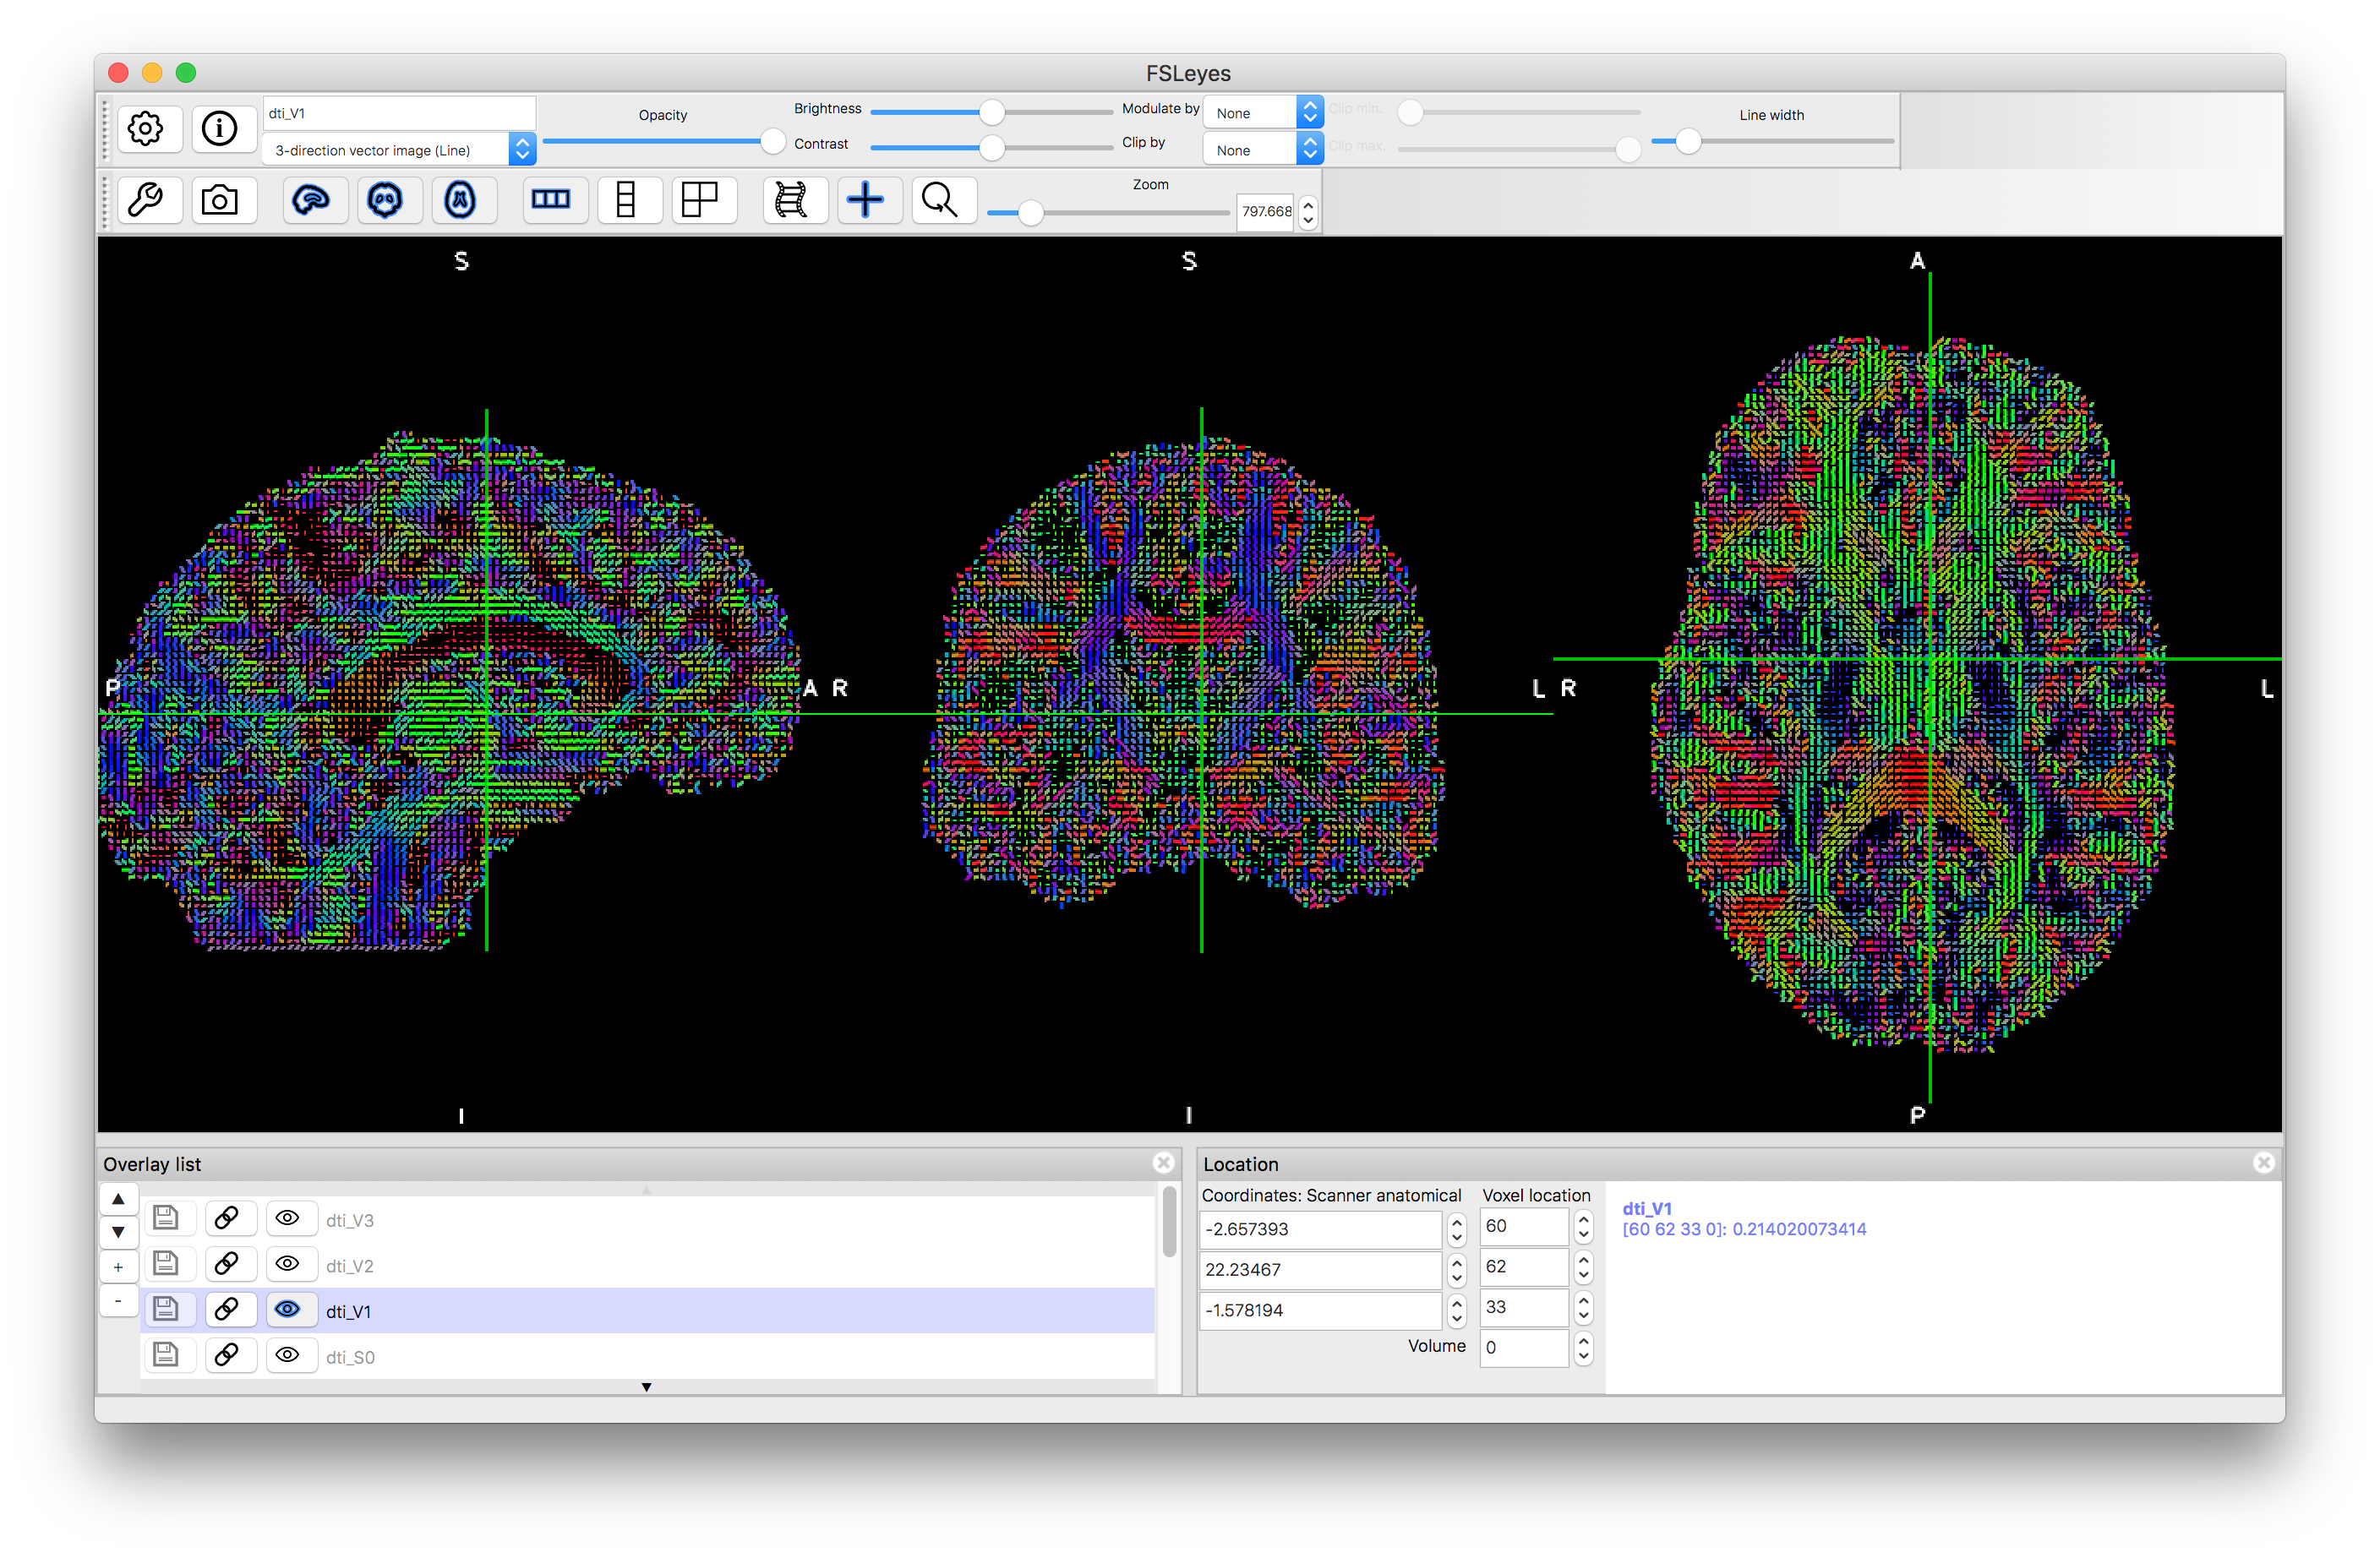
There are two options for viewing the vectors: either as a colour-coded voxels based on the direction (RGB format) or as coloured lines. You can change the format shown by fsleyes by using the pull down menu underneath the image name in the top left, above the image display - highlighted in red in the images below. The results should look something like this:
V1 as thin lines
V1 as thick lines
Zoomed in version of V1 as thick lines
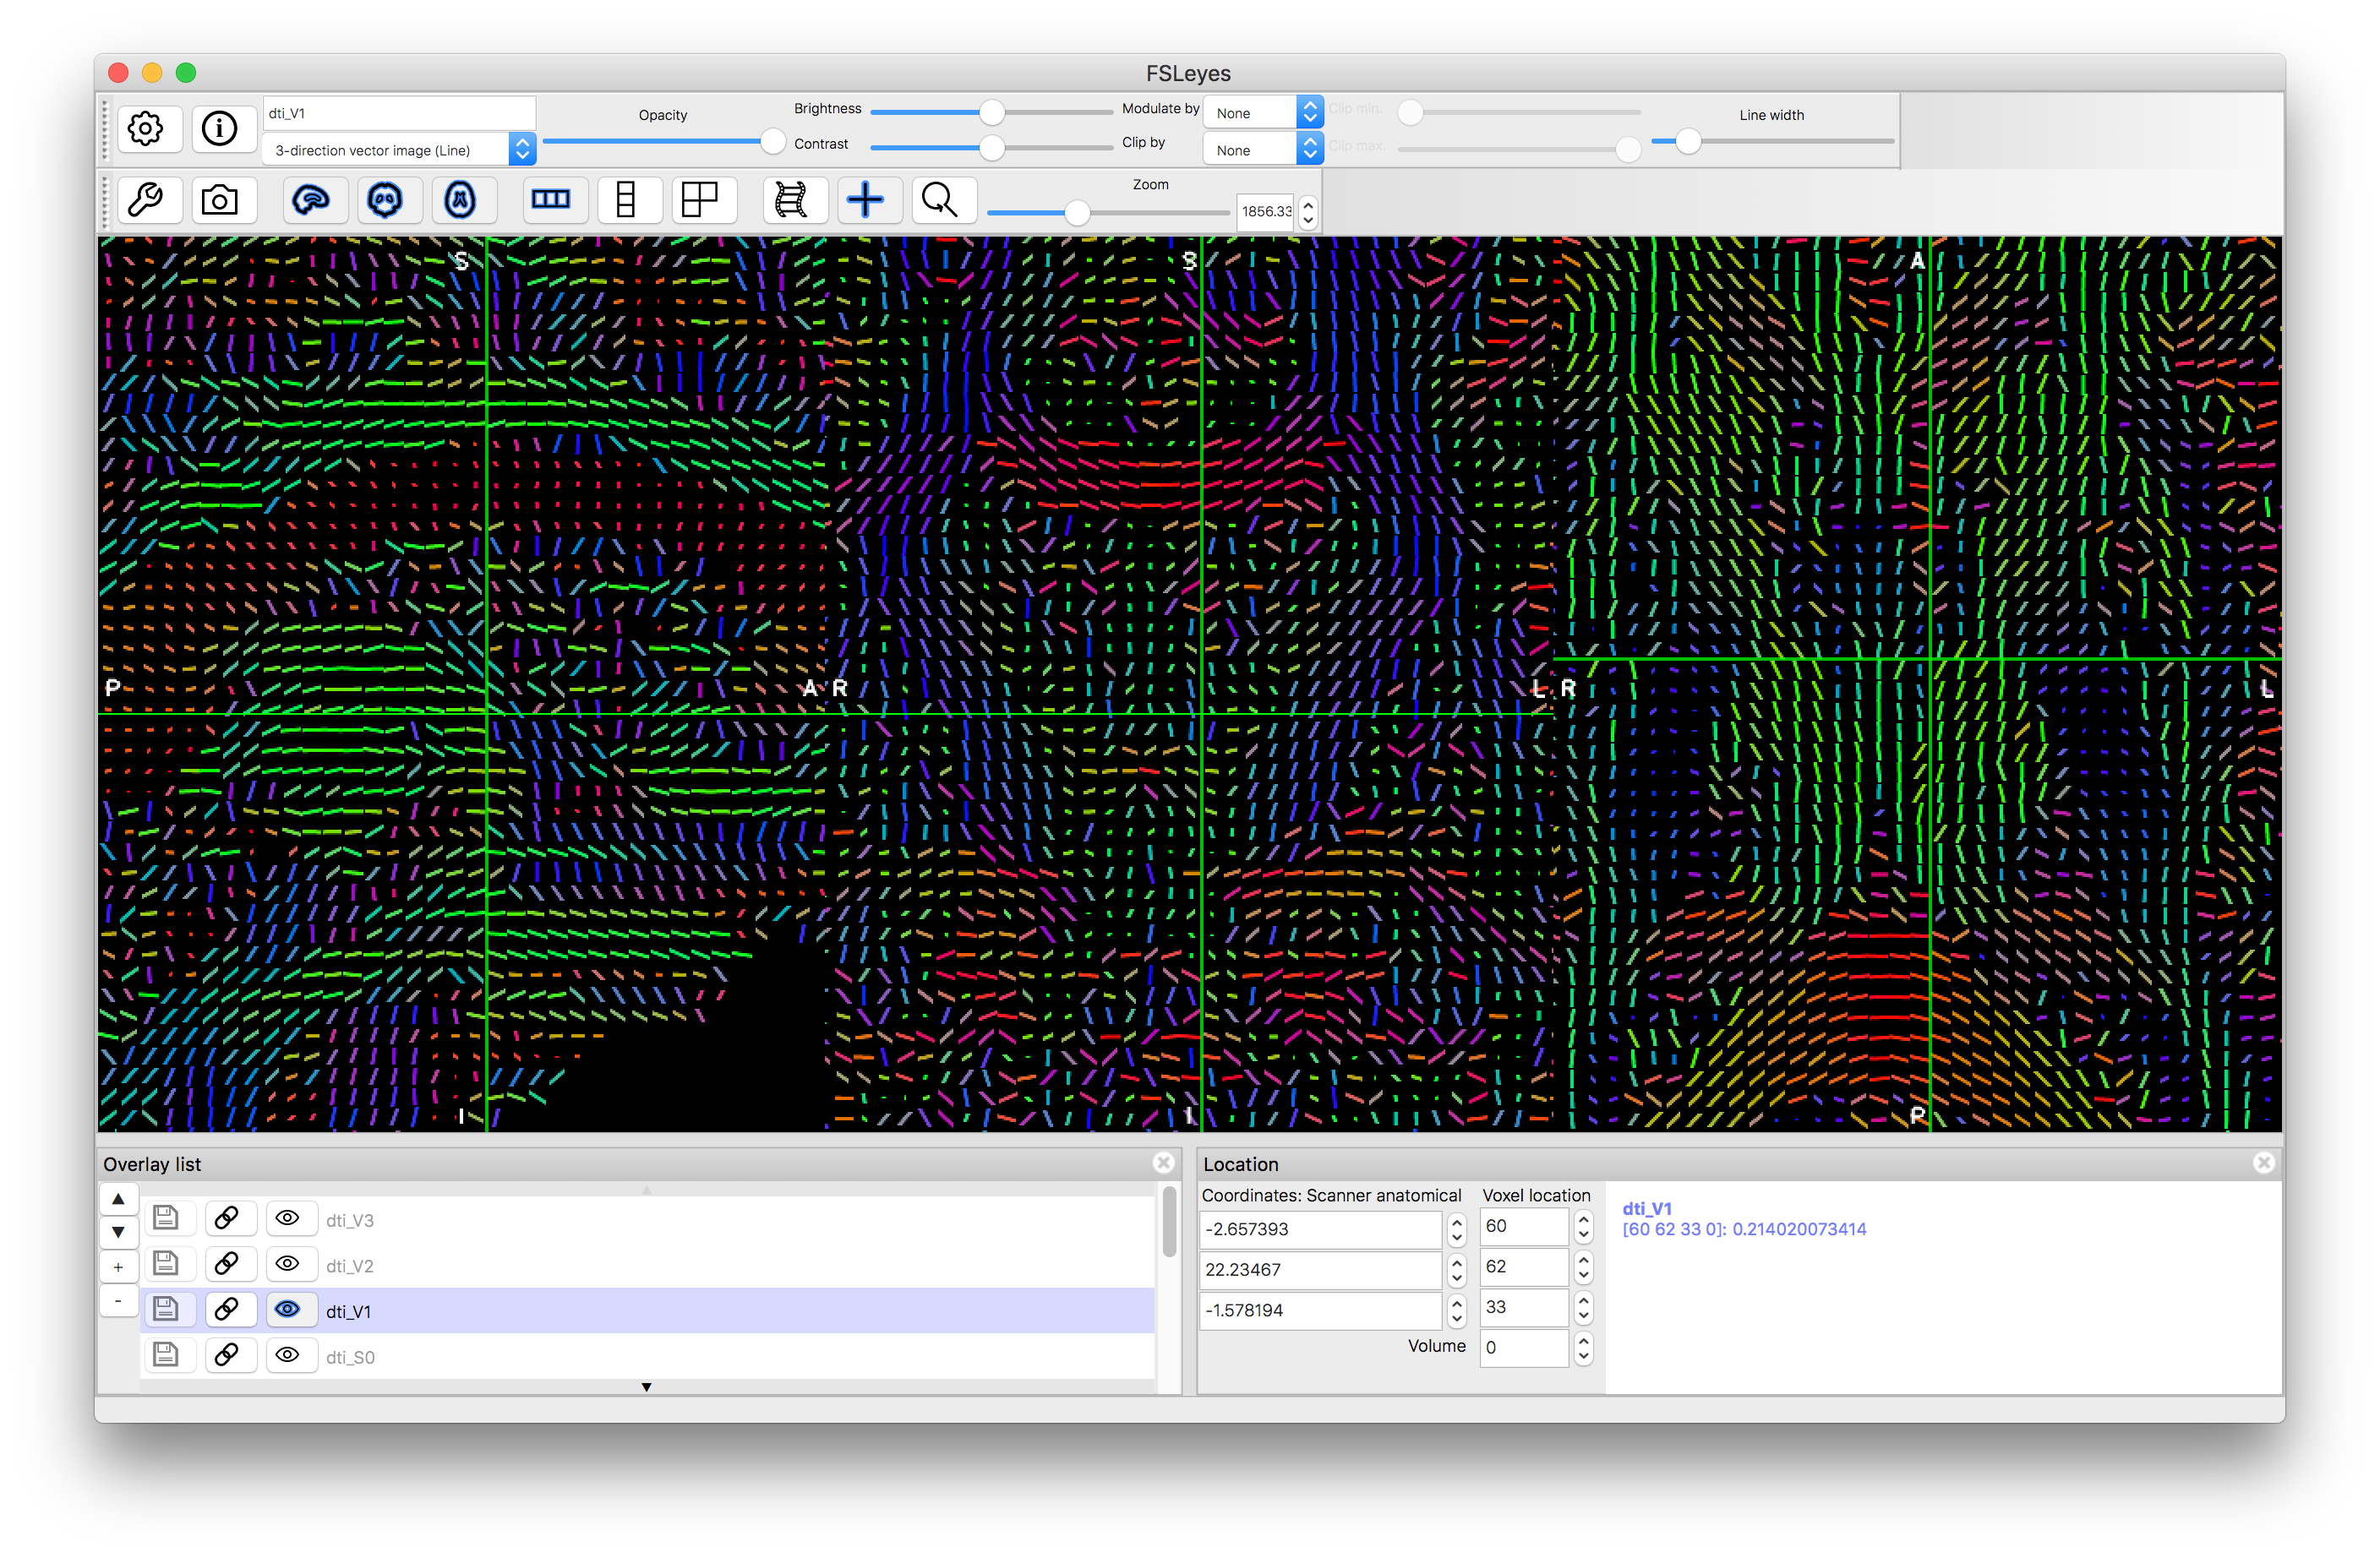
We have only shown the results for V1 here, as the other directions are often poorly estimated and very noisy in many areas, whereas in the V1 results you can see clearer features, such as the corpus callosum and other major fibre bundles.
This example should give you some familiarity with what the derived diffusion tensor quantities look like and what values they take on. Explore what they look like in major tracts and regions of crossing fibres to get a better feeling for what happens to these quantities, which will help you to interpret results from diffusion tensor analyses. In addition, running a simple DTI analysis like this is recommended for all diffusion experiments as a way of checking your data, as if there mistakes in the specification of the b-values of encoding directions then they should show up in these results - in particular, looking at the V1 vectors should always be done, as if these do not line up as expected in major tracts (e.g., corticospinal tract, corpus callosum, etc.) then that is a strong indication that something is wrong with the data.