Example Box: TBSS
Introduction
The aim of this example is to become familiar with what is produced by a TBSS analysis (voxelwise analysis of white matter).
This example is based on tools available in FSL, and the file names and instructions are specific to FSL. However, similar analyses can be performed using other neuroimaging software packages, although in this particular case there may be substantial differences in the approaches used.
Please download the dataset for this example here:
Data download
The dataset you downloaded contains the following files:
- Pre-processed diffusion data (calculated FA):
all_FA.nii.gz - Data after projection to the skeleton:
all_FA_skeletonised.nii.gz - Mean FA image:
mean_FA.nii.gz - Skeleton based on the mean FA image:
mean_FA_skeleton.nii.gz - Statistical results:
tbss_clustere_corrp_tstat1.nii.gzandtbss_clustere_corrp_tstat1_filled.nii.gz
Viewing the Data
To start with load the pre-processed data all_FA.nii.gz into a viewer (e.g. fsleyes) and inspect the image. In this particular example there are only images from six subjects and these are combined together in this image - change the "Volume" number to change between different subjects. The data here has been run through many different pre-processing steps, including the calculation of FA (from a diffusion tensor fit) and so all the images here are FA images and they have been aligned together. You can check on the quality of the alignment by flicking between the images or by running the movie mode.
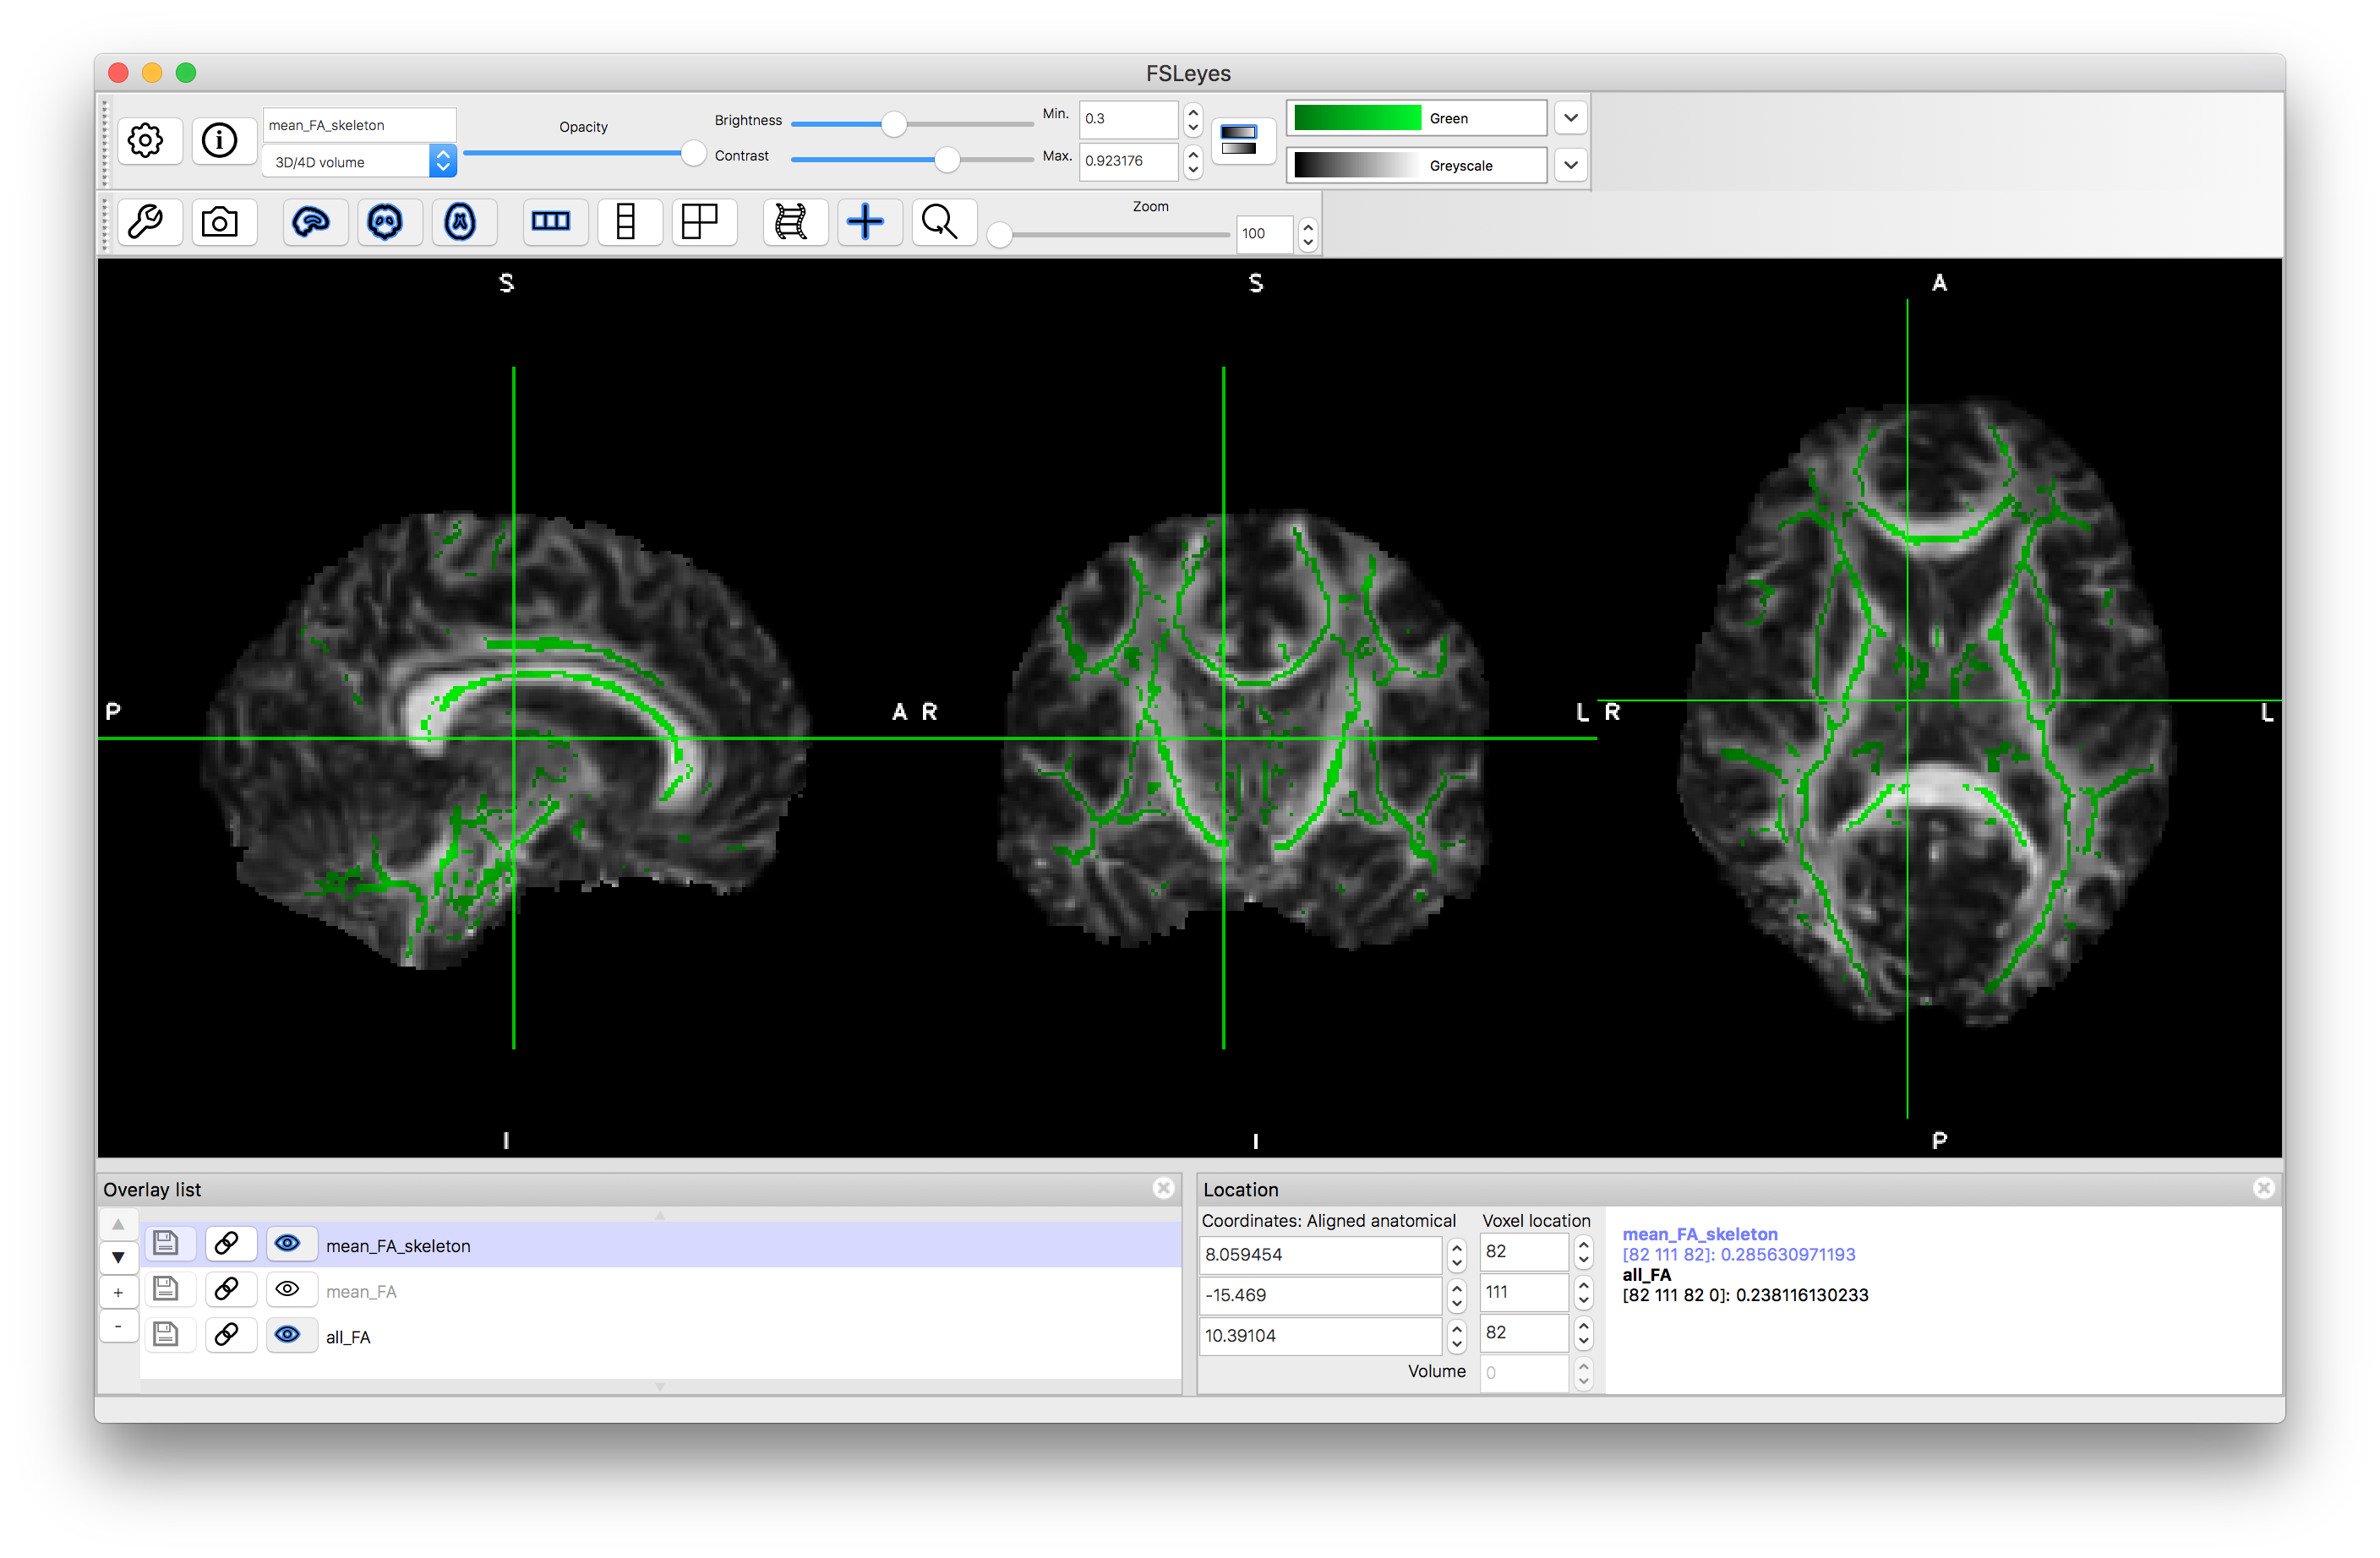
Now load the mean_FA.nii.gz image and notice how it appears more blurry than any of the individual FA images in all_FA. This is expected as the blurriness reflects some of the anatomical differences between subjects. It is this image that it used to derive the skeleton - the set of voxels along the middle of the major tracts. Load this skeleton in: mean_FA_skeleton.nii.gz and give it a colour (e.g. green). You can see that there are many tracts that are identified, although many are associated with weak and variable signals. Now select just the strongest tracts by "thresholding" the data (you are not really changing the data here, just what is displayed) by setting the "Min" value in the display range to 0.3. This will then only show voxels where the mean FA is above 0.3. It is these more major tracts that will be analysed.
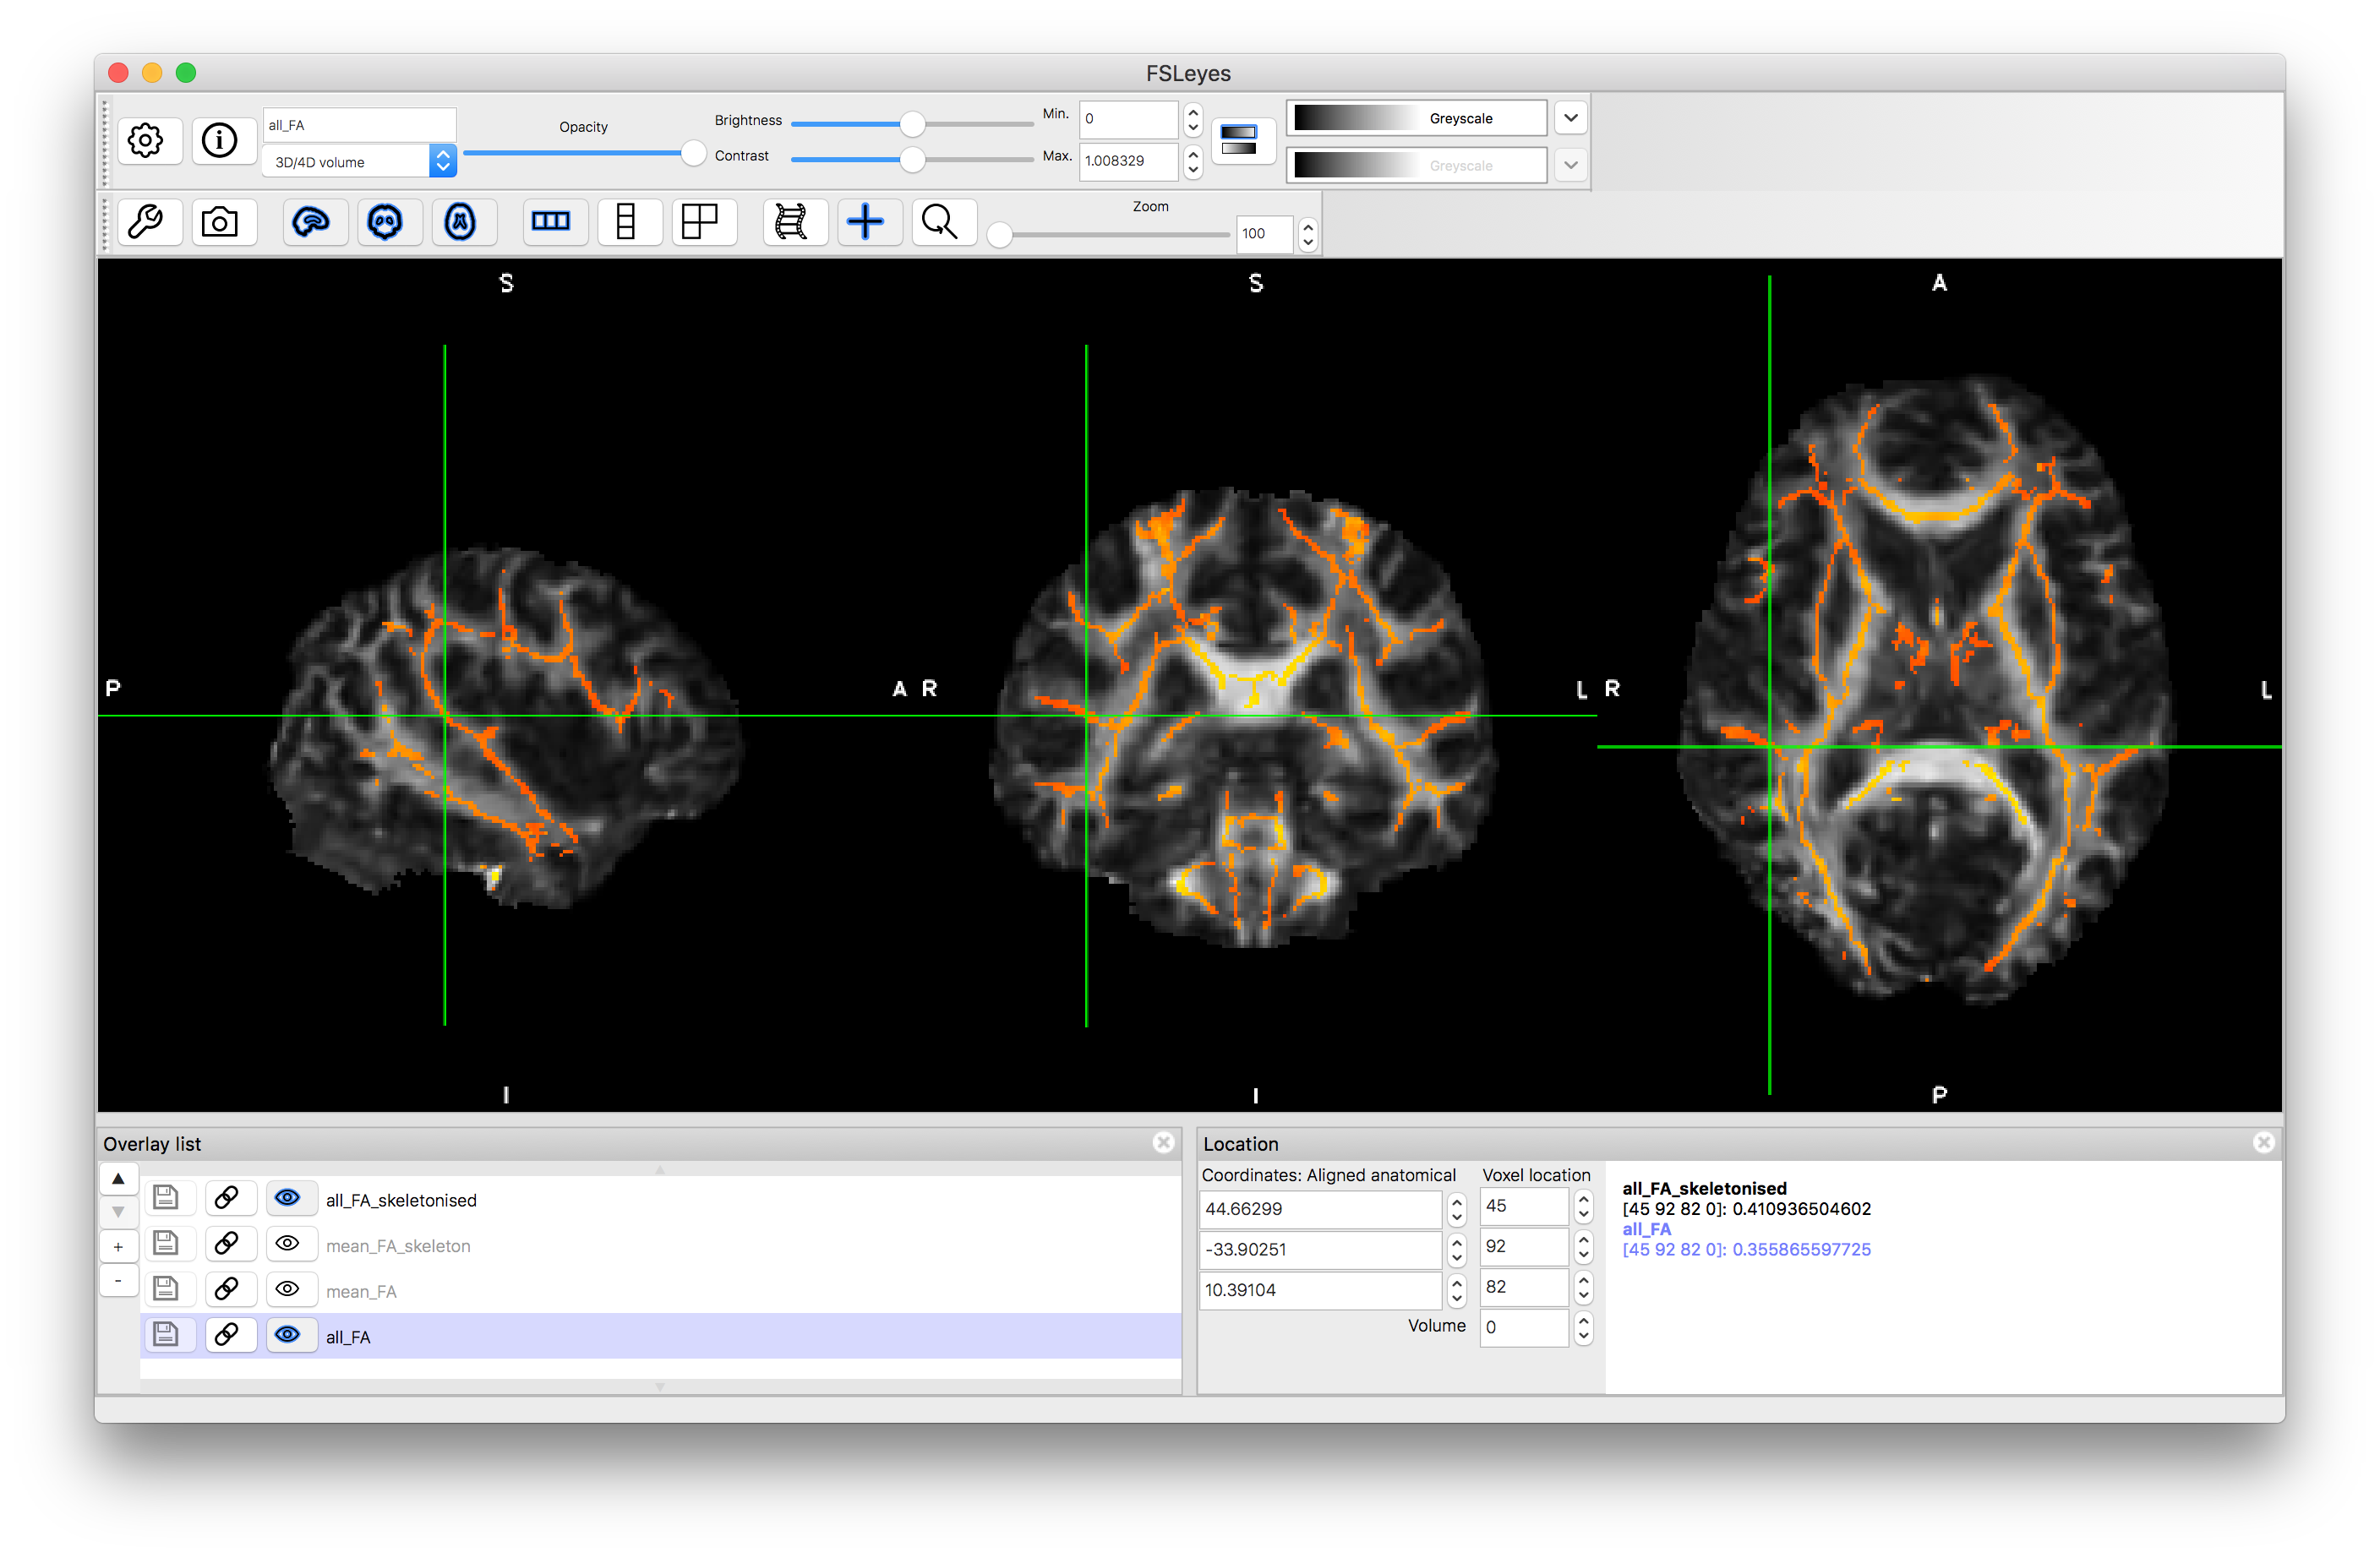
Load the all_FA_skeletonised.nii.gz image now, as this contains the values of FA, for each subject, that are projected onto this skeleton. Like the all_FA image it contains six volumes (one per subject) and you can step through these by changing the "Volume" number and seeing how the values themselves change. To get some feeling for the projection compare the FA values between the projected (skeletonised) version and the original. This can be done by selecting all_FA_sekeletonised image in the overlay list, giving it a colour (e.g. Red-Yellow), deselecting both the mean_FA and mean_FA_skeleton images in the overlay list (clicking on the "eye" icon to stop them being shown) and then making sure the all_FA image is selected (the "eye" is "on"). Once this is done the bottom right panel will show the intensities (the FA value) for both the all_FA_skeletonised and all_FA images. Then click around on skeleton voxels and you will note that a lot of the time they will be exactly the same value but sometimes they are different (if they are always different then you probably are looking at different subjects - check that the "Volume" number for both images is the same and then proceed). Voxels where the values are different represent instances where nearby FA values were "projected" onto the skeleton. That is, there was a value close by in that subject's FA image that was higher than the value on the skeleton and so the nearby one was used instead as the centre of the tract is most likely to be at the point of highest FA and so by doing this projection, there is an additional compensation for small misalignments. You are more likely to find such misalignments in the peripheral tracts, as the major central tracts are normally well aligned.
Statistics
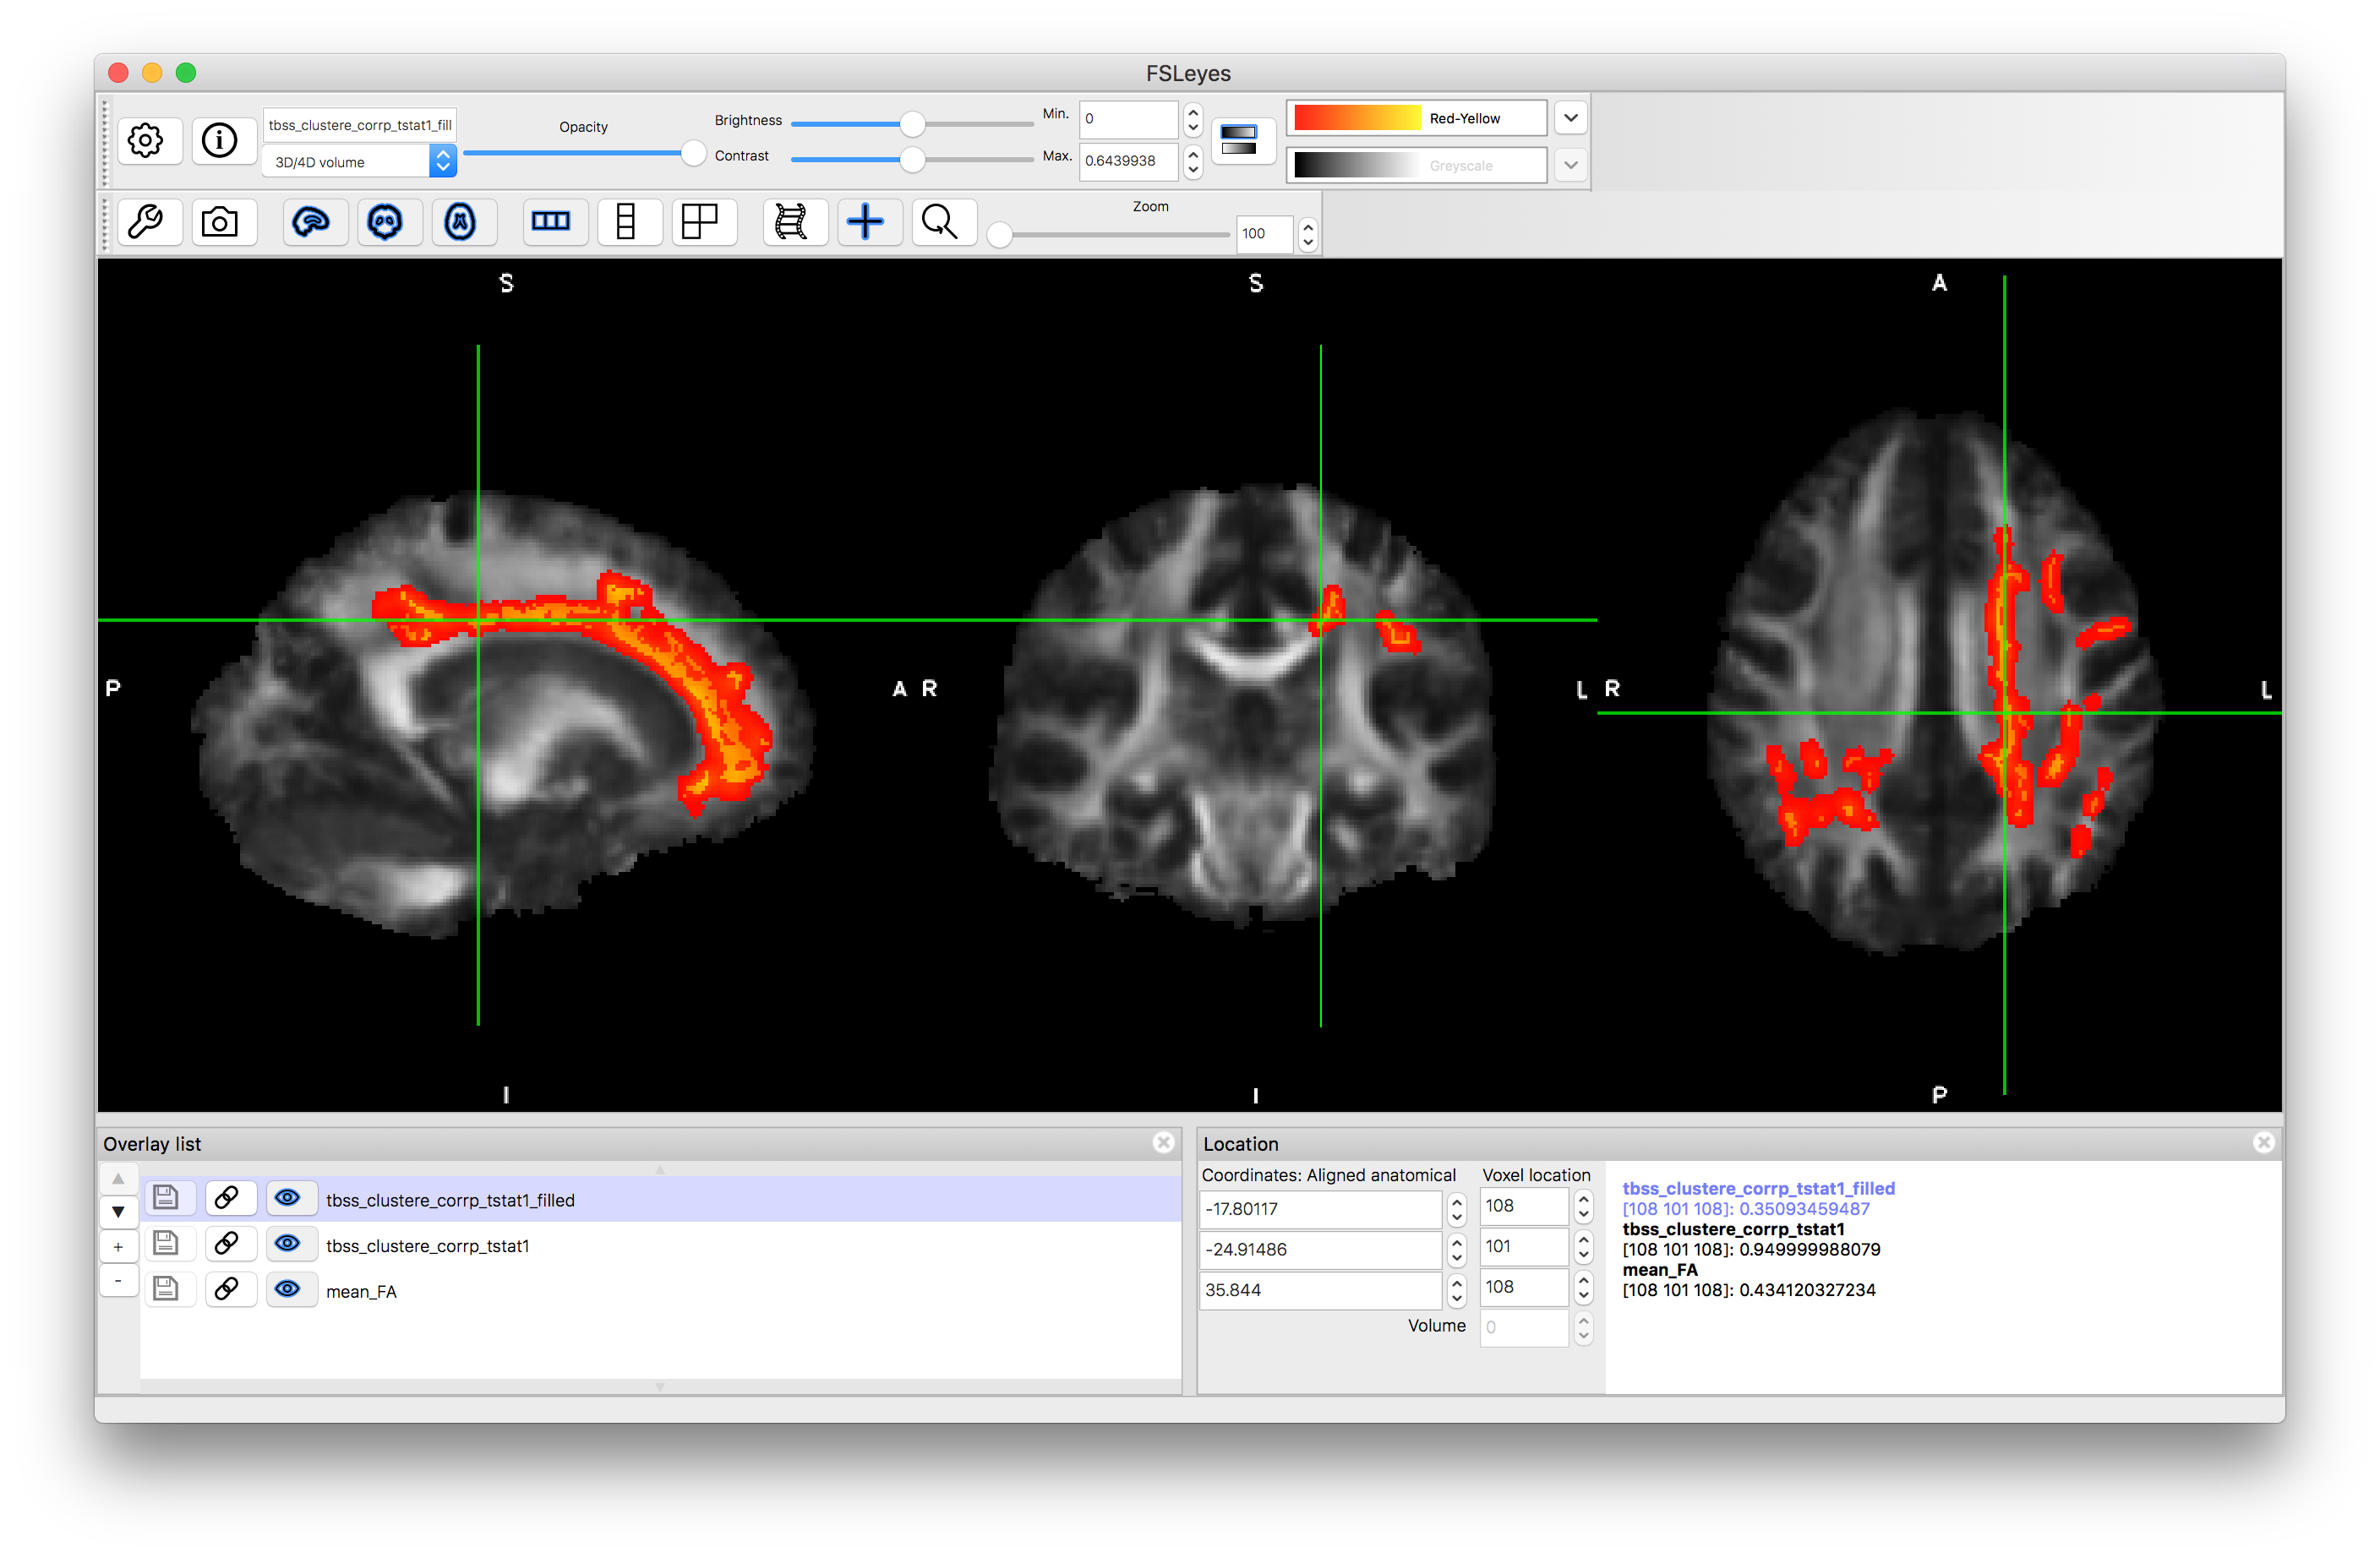
Now remove all images except the mean_FA from the viewer and then load the two statistical results: tbss_clustere_corrp_tstat1.nii.gz and tbss_clustere_corrp_tstat1_filled.nii.gz
Give these statistical results some colour and set the "Min" of the display range to 0.949, which corresponds to doing a 0.05 statistical threshold. Here the results relate to very strong age-related differences comparing people aged around 25 to those aged around 65 (note that only very strong differences would show up in an analysis comparing two groups of three subjects!) and the results can be seen either as individual voxels on the skeleton or as an enlarged view (for better visualisation) with the "filled" version. They both correspond to the same results, and only the voxels on the skeleton are truly valid - the other is purely for nice visualisation. Have a look at the distribution of these results.
This example demonstrates how the FA values are stored and projected onto the skeleton in a TBSS analysis. More details of TBSS can be found on the FSL wiki.