Biomedical Sciences - Matlab introduction 2
Before you start
Today rather than typing commands in the command window, we will be using the MATLAB editor. This is a text editor where you can type all your matlab commands and programs, then MATLAB can run all the code written in there at once. It's also a useful way of keeping track of what you have done.
Here is a tip on how you can organise basic commands in an editor and execute them simply:
This practical is about FOR LOOPS and IF STATEMENTS.
What are 'FOR loops'?
FOR loops are useful in many circumstances. The purpose of a FOR loop is to 'repeat a set of instructions'. It is useful to have the ability to tell MATLAB to repeat an instruction without having to repeat the actual code.
For example, if we want MATLAB to do some operation 100 times, we could either write down the code for that operation 100 times in succession, or simply use a FOR loop and write the operation only once.
Let us do a simple example. The following command tells MATLAB to display a variable 10 times:
      a=3;
      for i = 1:10
         disp(a);
      end
In the above, we first define a variable a to which we
assign the value 3. Then we have a FOR loop that displays the
variable a with the command disp. Let us
examine the syntax of this FOR loop:
In the Matlab language, the FOR loop always begins with the word
for and ends with the word
end. Everything that is in between for and
end gets executed.
Just after the word for, we have an iterator
called i that will take values from 1 to 10. This means
the FOR loop will run 10 times, each time the value of i will be
incremented by 1, starting at 1 and ending at 10.
We can actually display the value of i inside the
loop to check that is what is happening (also, the iterator doesn't
need to be called i so let us use, say, j instead):
     for j=1:10
        disp(j)
     end
Now what we have done so far are not very useful things to do with loops, they were just meant to introduce you to the syntax.
A more useful use of a FOR loop is to use the iterator to access a given entry of a variable. Let us do an example where we access entries in a cell array of words, e.g. calendar months. First define a variable with all the calendar months (remember: as in the intro to MATLAB 1, we use curly brackets for text):
months = {'January' 'February' 'March' 'April' 'May' 'June' 'July' 'August' 'September' 'October' 'November' 'December'};
Now we will use a FOR loop to extract the name of 'every other month' starting with January:
    for i=1:2:12
       disp(months{i});
    end
Let us understand the syntax above. In the first line of the FOR loop, we have an iterator that starts at 1, ends at 12, with a step of 2. Then inside the loop, we use the iterator value to extract the relevant calendar month.
Let us do another where we start with December all the way down to January in steps of 3:
     for i=12:-3:1
        disp(months{i});
     end
So to summarise FOR loops so far: we can use a FOR loop to repeat an operation. The iterator takes values during these repeats; and we can use the iterator inside the FOR loop to access elements of a variable.
Using FOR loops to do maths
Now let us perform actual mathematical operations inside FOR loops.A simple example is to write a FOR loop that calculates a sum of numbers from 1 to 100. First, how can we do this without FOR loops?
A silly way would be to type out all of the numbers and add them up:
  total_silly=1+2+3+4+5+6+7+8+9+10+11+12+13+14+15+16+17+18+19+20+21+22+23+24+25+26+27+28+29+30+31+32+33+34+35+36+37+38+39+40+41+42+43+44+45+46+47+48+49+50+51+52+53+54+55+56+57+58+59+60+61+62+63+64+65+66+67+68+69+70+71+72+73+74+75+76+77+78+79+80+81+82+83+84+85+86+87+88+89+90+91+92+93+94+95+96+97+98+99+100;
  disp(total_silly)
Let's see if we can do something better with a FOR loop. We start by defining a variable that will
store the value of the summation. Let us call it total, and
at the start initialize it to 0. Then within each iteration of the
loop we increase this variable by the value of the iterator.
Here is a 'pseudo' code for what we will be doing:
  1) Set the value of 'total' to be equal to 0.
  2) Iterate over a variable taking values from 1 to 100:
     - at each iteration, increase the value of 'total' by 'i'
     - store the result in the variable 'total'
  3) End the iterations and display the variable 'total'.
And now for the actual code:
    total=0;
    for i=1:100
       total = total+i;
    end
    disp(total)
Compare 'total' to 'total_silly'.
Excercise: Use a FOR loop to calculate the sum of all even numbers from 2 to 2021. Answer
Using an analogous approach, we will now write a program that calculates N!
(factorial of N, or 1x2x3x4x...xN) for an integer number N. Let's say for N=10.
Try to first do it yourself, and if you get stuck, then look at the solution below.
First let us assign a value for N:
N=10;
Now we will write a for loop that calculates N!. For that, we first
define a variable F and assign it the value 1, then we use a loop:
    F=1;
    for i=1:N
       F = F*i;
    end
    disp(F)
In each iteration we multiply the current value of F with i, and assign that result to the variable F.
Try with different values for N. You should see that the result grows very quickly as N gets bigger and bigger.
Excercise: Calculate the value of N! for all N between 1 and 5 and make a plot of N! as a function of N. Answer
Double FOR loops
If you have clicked on the answer to the previous excercise, you would have noticed that we did the silly thing of repeating code instead of using a loop. Can you guess how we could have done the same thing but using a loop instead of repeating code?
Answer
Double FOR loop: now let us have a look at FOR loops inside FOR loops! Remember in the intro to MATLAB plotting practical we drew the 2D functionf(x,y)=sin(x2+y2). If you recall we
did the following:
    x=linspace(-2*pi/5,2*pi/5,100);
    y=linspace(-2*pi/5,2*pi/5,100);
    [x,y]=meshgrid(x,y);
    z=sin(x.^2+y.^2);
Now the use of meshgrid was to make sure that z
calculates all possible combinations of x and y. We can achieve the
same thing with a loop inside a loop as follows:
First, redefine x and y as vectors:
    x=linspace(-2*pi/5,2*pi/5,100);
    y=linspace(-2*pi/5,2*pi/5,100);
Now we can use a double loop to get all combinations of x's and y's:
    z = zeros(100,100);
    for i=1:100
       for j=1:100
          z(i,j)=sin( x(i)^2 + y(j)^2 );
       end
    end
Below we plot z
    figure;
    mesh(z);
How does it work? The first loop creates an iterator called
i that increments its value by 1 every iteration. Inside
each iteration on i, the second FOR loop creates a second
iterator j that also takes values from 1 to 100.
Because the second loop is inside the first loop, each value
of i is used in combination with every value of j.
Note that we initialise z to be a 100x100 table of
zeros. Then for each row i, and for each column j, we extract the i-th
element of x and j-th element of y to calculate z(i,j). This ensures
that z contains combinations of all x's and all y's. You should be
able to see that the two approaches yield identical results.
IF Statements
A useful thing to be able to do when programming is to ask a question with YES/NO answer and do something that depends on what the answer is. For example, inside a FOR loop, only execute a command if some statement is true, or exit the loop immediately if some statement is true.
Let's go back to the example we have seen above where we printed the name of every other calendar month. First define a variable with month names again (in case you've deleted it from the workspace):
months = {'January' 'February' 'March' 'April' 'May' 'June' 'July' 'August' 'September' 'October' 'November' 'December'};
Now we will create a loop that only displays the name of every other month, but where the iterator actually goes through all the numbers from 1 to 12 (rather than skip every other number). We include an IF statement that asks whether the iterator is even or odd:
    for i=1:12
       if(rem(i,2)==1)
          disp(months{i});
       end
    end
Let's try to understand the above commands. Firstly, we have an IF
statement that ends with an end (just like the FOR
loop does). Inside the brackets, we ask the question. In this
particular case, we ask whether the iterator i is even or
odd. We do this using the command rem. What does this do?
The command rem(x,y) gives the
remainder of dividing x by y (see help rem). Therefore,
when we write rem(i,2), we calculate the remainder of
dividing i by 2. If you remember your high school maths,
this should be equal to 0 for even numbers and to 1 for odd numbers.
So anything inside the IF statement will be executed if
rem(i,2) is equal to 1, or else the FOR loop carries on.
You can also have an alternative command you can run if the
statement inside the IF is false. This can be done with the commands
if...else...end.
Let's do a fun example by finding which months have an "R" in them:
   for i=1:12
       if( strfind(months{i},'r'))
          disp([months{i}  ' has an r in it.']);
       else
          disp([months{i}  ' does not have an r in it.']);
       end
    end
The command strfind(a,b) returns 'true' if the text 'b'
is contained in 'a', and it returns 'false' otherwise. Note also the
use of the square brackets [] to concatenate pieces of text together.
Excercise: Can you write a FOR loop with an IF/ELSE statements which writes out which months start with a vowel and which don't?
Answer
Excellent, now you know what a FOR loop is, and you know how to use an IF statement inside a FOR loop. Let us use these two pieces of knowledge to do something more complicated.
Something more complicated
Here we use FOR loops and IF statements to model the growth of a population of cells. We will consider a model where we start with a given number of cells, we know the birth-rate and the death-rate, and we try to see what happens to the number of cells over time.
To add IF statements, we will consider a rather biologically suspicious variation on the model. But first, let us play with the simple birth/death rate model.
We begin by creating a variable n0 (starting number of
cells), and two rate variables b and d
(respectively birth and death rates). We set these to some arbitrary
values:
    n0=100;
    b=0.01;
    d=0.05;
Now we write a loop that calculates the number of cells over time. Say at time t=1h, the number of cells is n0, and we simulate until t=5000h:
    n=zeros(1,5000);
    for t=1:5000
       if(t==1);
         n(t)=n0;
       else
         n(t)=n(t-1)+b*n(t-1)-d*n(t-1);
       end
    end
What have we done? In our FOR loop, we ask if t is equal to 1, in which case we set the number to be equal to 'n0' (our starting value). Otherwise, we set our number to be equal to the previous number, plus the newborn cells, minus the dead cells. We use our rate variables and multiply them by the previous number of cells to get the birth/death in cells.
Now let us plot the results:
plot(n)
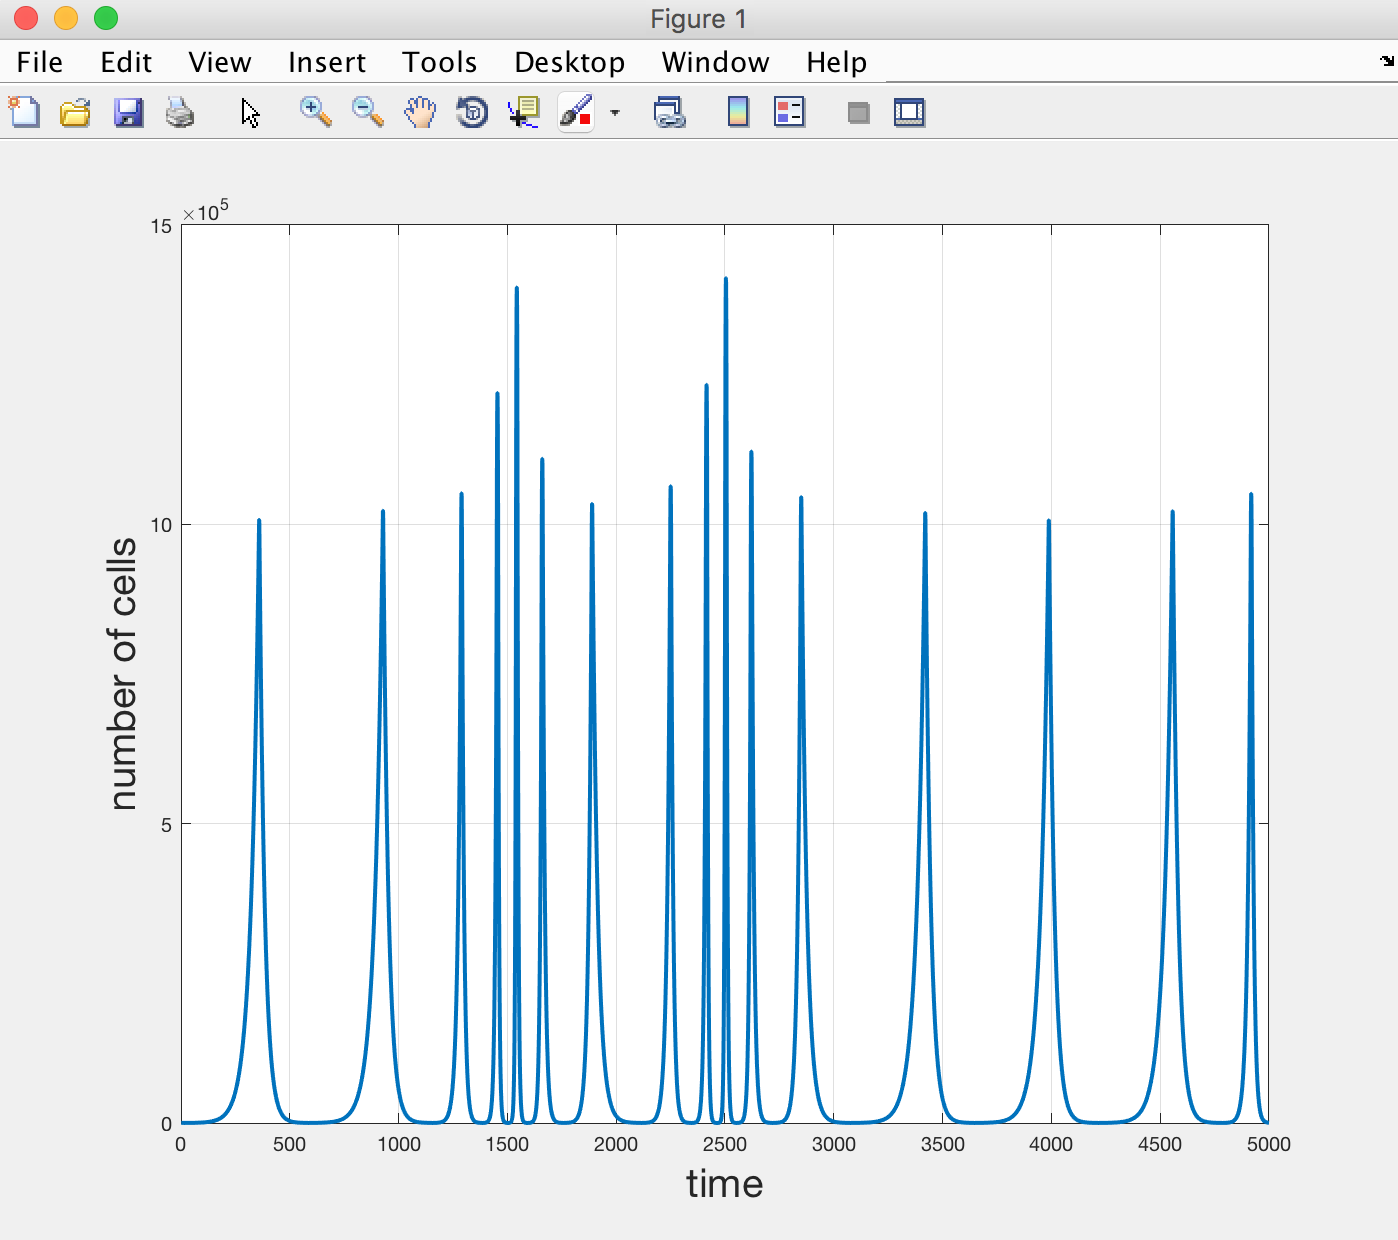
It is clear that the number of cells dies out exponentially (because the death rate is larger than the birth rate).
This is rather boring. So we will add some new rules to make the dynamics more interesting (and also to introduce some more IF statements).
Here are our two new rules:
- If the number of cells drops below 100, double the birth rate and halve the death rate.
- If the number of cells grows above 1 million, double the death rate and halve the birth rate.
These rules may sound a bit arbitrary, and indeed they are. But you can see what we are doing here. If there are too many cells, make them die faster and multiply more slowly (perhaps due to shortage of nutrients), and vice versa if there are not that many cells.
It is easy to code these two new rules with two new FOR loops. See code below and make sure you understand it. Note our IF statements are in a single line. This is allowed as long as we use commas between the different bits of code.
    n=zeros(1,5000);
    for t=1:5000
       if(t==1);
         n(t)=n0;
       else
         n(t)=n(t-1)+b*n(t-1)-d*n(t-1);
       end
       if(n(t)>1e6); d=2*d; b=b/2; end
       if(n(t)<1e2); d=d/2; b=b*2; end
    end
If you plot the results, you should be able to see a funky dynamic to the cell number, a bit aperiodic like so:
Something even more complicated
Now we are going to try to solve an actual problem using FOR loops and IF statements.
The problem is the following:
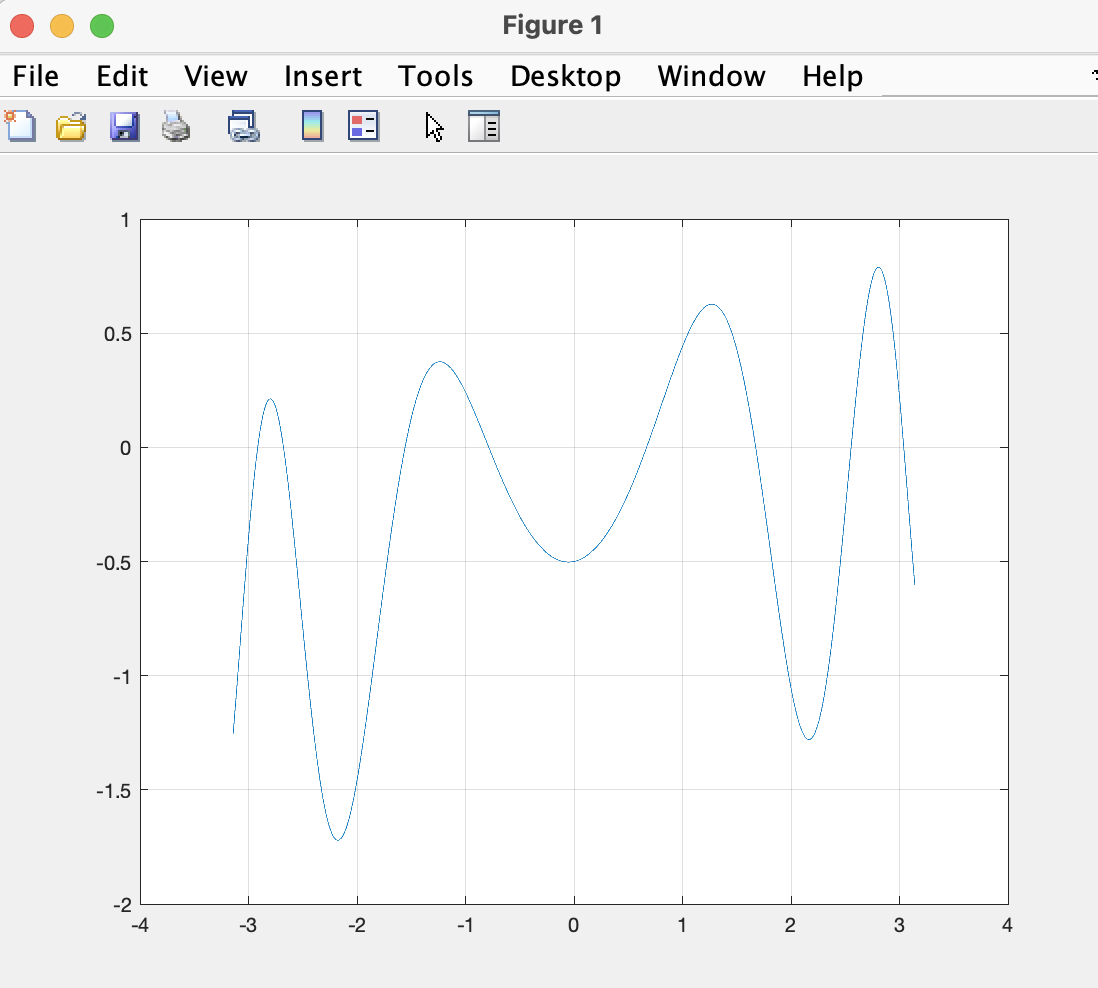
Find the values of x between -π and π where sin(x2)+tan(x/10)-1/2 is zero
If we plot this function you can see that it crosses zero a few times:
    x=linspace(-pi,pi,10000);
    y=sin(x.^2)+tan(x/10)-1/2;
    plot(x,y)
    grid on
Now let's try to solve the problem. If you are feeling brave you can stop reading now and try to solve it yourself.
First we define a vector x like we did above for plotting:
x=linspace(-pi,pi,10000);
Then we write a loop over the values of x, where we calculate the value
of the function f(x)=sin(x2)+tan(x/10)-1/2 and
check whether f(x) changed from a positive to a negative
value or vice versa. If it has done so, then it must have passed through
zero (unless the function jiggles about very rapidly, which it
doesn't):
    v=[];
    for i=2:length(x)
       y1 = sin(x(i-1)^2)+tan(x(i-1)/10)-1/2;
       y2 = sin(x(i)^2)+tan(x(i)/10)-1/2;
       if( sign(y1*y2)<0 )
          z=(x(i-1)+x(i))/2;
          v=[v z];
       end
    end
Well, that is a lot of new commands! Let's start from the top:
We started with v=[]. This vector is going to store
the values of x for which f(x) is zero. But it starts as an empty
vector that we are going to fill as we go along in the loop.
Then we loop, starting at i=2 (can you see why?)
We calculate the value of f(x) at the current and previous position. We call these y2 and y1 respectively.
We calculate the sign of their product. This sign will only be negative if one of them is negative and the other positive (doesn't matter which). This means we have crossed zero!
We then calculate the value of x for which the crossing happens (we call it z). We approximate this with the middle point between the current and previous x position. This is an approximation of course, and can get better if x has a much higher 'resolution'.
We append this value z to the vector v and carry on till the end of the loop.
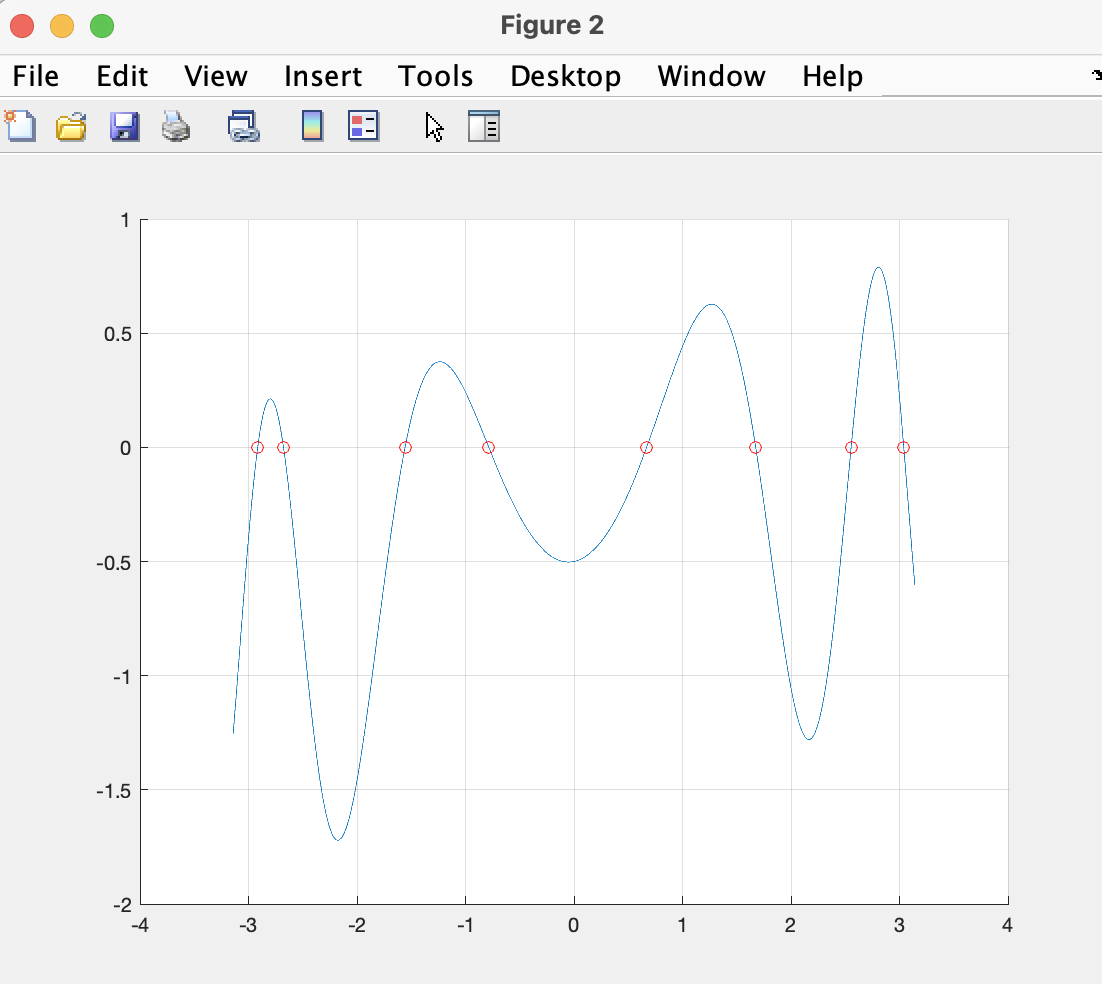
Now let's plot the function and the values at which it crosses zero:
    figure,hold on
    plot(x,y);
    plot(v,0,'ro');
    grid on
You should be able to see this:
Final note: MATLAB programming can be very elegant. The examples above are meant to illustrate the use of FOR loops and IF statements, but these loops are not always necessary to solve these types of problems. For example, this last problem of finding zero crossings can be solved with this two-liner:
     y = sin(x.^2)+tan(x/10)-1/2;
     v = x(abs(diff(sign(y)))==2);
The End.
Created by Saad Jbabdi (saad@fmrib.ox.ac.uk)