


Next: Validation: Comparison with empirical
Up: Local Parameter Estimation
Previous: Estimation
Local Parameter Estimation: Results
Example distributions from a single voxel. Figure
1 (a) and (b) show samples from the marginal
posterior distributions on  and
and  from the diffusion
tensor model. The voxel was chosen from the splenium of the Corpus
Callosum. (c) shows (a) and (b), plotted as a joint histogram around
the surface of a sphere. This is then the joint marginal posterior
distribution of and or the marginal posterior
distribution of principal diffusion direction (PDD). Note how narrow this
distribution is. This represents a high confidence in our calculated
PDD, which is as predicted in an area of dense white matter such as
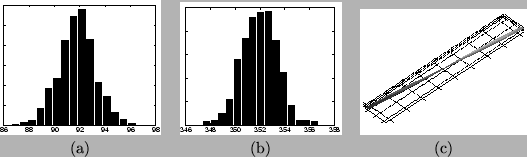
the corpus callosum. Figure 2 (a) and (b) show
samples from the marginal posterior distributions on and
from the simple partial volume model. The same voxel was
chosen as in Figure 1. Again (c) shows (a) and (b),
plotted as a joint histogram around the surface of a sphere.
from the diffusion
tensor model. The voxel was chosen from the splenium of the Corpus
Callosum. (c) shows (a) and (b), plotted as a joint histogram around
the surface of a sphere. This is then the joint marginal posterior
distribution of and or the marginal posterior
distribution of principal diffusion direction (PDD). Note how narrow this
distribution is. This represents a high confidence in our calculated
PDD, which is as predicted in an area of dense white matter such as
the corpus callosum. Figure 2 (a) and (b) show
samples from the marginal posterior distributions on and
from the simple partial volume model. The same voxel was
chosen as in Figure 1. Again (c) shows (a) and (b),
plotted as a joint histogram around the surface of a sphere.
Figure 1:
Samples from marginal posterior distributions of the
diffusion tensor model in a white matter voxel. (a) shows samples from
the marginal posterior distribution on . (b) shows samples
from the marginal posterior distribution on . (c) shows (a) and
(b) plotted around a sphere, representing the marginal posterior
distribution on principal diffusion direction.
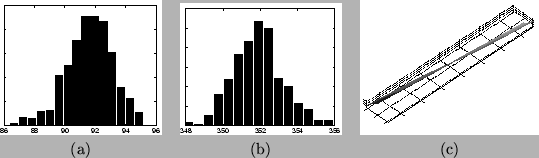 |
Figure 2:
Samples from marginal posterior distributions of the
partial volume model in a white matter voxel. (a) shows samples from
the marginal posterior distribution on . (b) shows samples
from the marginal posterior distribution on . (c) shows (a) and
(b) plotted around a sphere, representing the marginal posterior
distribution on principal diffusion direction.
 |
Subsections
Next: Validation: Comparison with empirical
Up: Local Parameter Estimation
Previous: Estimation
Tim Behrens
2004-01-22