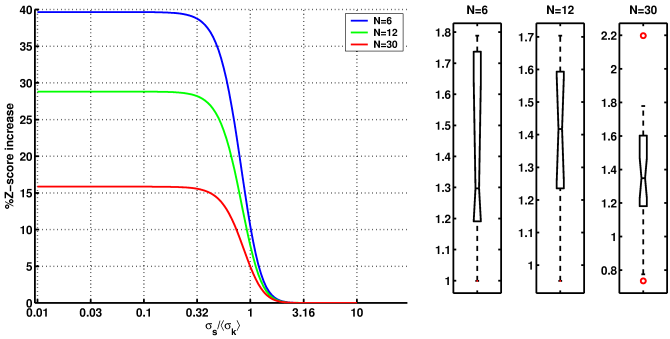
Similar to before, figure 5 shows the expected
percentage increase in ![]() -score for the heteroscedastic vs. the
homoscedastic model. Again, depending on the explicit configurations of
first-level variances, a substantial increase in
-score for the heteroscedastic vs. the
homoscedastic model. Again, depending on the explicit configurations of
first-level variances, a substantial increase in ![]() -score can be
observed.
-score can be
observed.
|
|