Figures 7 and 8 show
cluster-thresholded (
![]() ) group activation for the
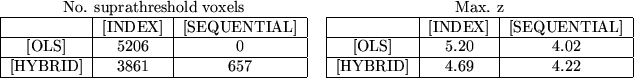
two motor tasks. Table 9 shows the
number of suprathreshold voxels and the maximum z-statistics for
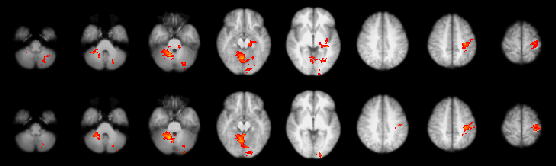
the two tasks. Figure 7 shows the results
from index finger tapping against rest ([INDEX] dataset). There is
a general decrease in z-statistics in potentially activating
voxels. This demonstrates the dominance of one of the two possible
effects of incorporating first-level variances into the second
level estimation process - that is we get an increase in estimated
group variance,
) group activation for the
two motor tasks. Table 9 shows the
number of suprathreshold voxels and the maximum z-statistics for
the two tasks. Figure 7 shows the results
from index finger tapping against rest ([INDEX] dataset). There is
a general decrease in z-statistics in potentially activating
voxels. This demonstrates the dominance of one of the two possible
effects of incorporating first-level variances into the second
level estimation process - that is we get an increase in estimated
group variance, ![]() , due to it being constrained to be
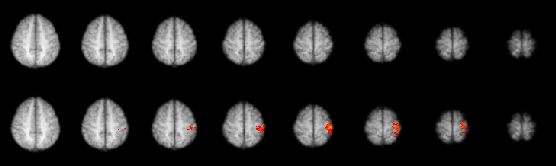
positive. Figure 8 shows the results of a
contrast of sequential finger tapping vs index finger tapping
([SEQUENTIAL] dataset). There is a general increase in
z-statistics in potentially activating voxels. This demonstrates
the dominance of the other possible effect of incorporating
first-level variances into the second level estimation process -
that is we get increased efficiency in parameter estimation due to
the use of lower-level variance heterogeneity.
, due to it being constrained to be
positive. Figure 8 shows the results of a
contrast of sequential finger tapping vs index finger tapping
([SEQUENTIAL] dataset). There is a general increase in
z-statistics in potentially activating voxels. This demonstrates
the dominance of the other possible effect of incorporating
first-level variances into the second level estimation process -
that is we get increased efficiency in parameter estimation due to
the use of lower-level variance heterogeneity.
 |
 |
 |