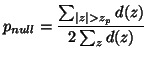
We now want to ascertain the difference in the
the bias of the resulting statistical distributions
that exists for the different approaches for estimating the autocorrelation.
This is determined experimentally on real rest (null) FMRI data by
computing the t-statistic at each voxel for a dummy design paradigm
The t-statistic is given by
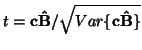 where
where
![]() and
and
![]() are given by equations 2 and 3 respectively.
The t-statistics are
then probability
transformed to z-statistics. The probability transform
involves converting the t-statistic into its corresponding
probability (by integrating the t-distribution from the
t-statistic's value to infinity)
and then calculating the z-statistic that corresponds to
the same probability (by integrating the normal distribution from the
z-statistic's value to infinity).
are given by equations 2 and 3 respectively.
The t-statistics are
then probability
transformed to z-statistics. The probability transform
involves converting the t-statistic into its corresponding
probability (by integrating the t-distribution from the
t-statistic's value to infinity)
and then calculating the z-statistic that corresponds to
the same probability (by integrating the normal distribution from the
z-statistic's value to infinity).
These z-statistics form what we refer to as the null distribution. A technique with low bias should give a null distribution that closely approximates the theoretical z-distribution (or Normal distribution).
For the theoretical, Normal probability density function, ![]() ,
we can obtain the z-statistic,
,
we can obtain the z-statistic, ![]() ,
for a chosen probability
,
for a chosen probability ![]() such that
such that
![]() .
This can then be compared to
.
This can then be compared to
![]() for the
empirically obtained null distribution,
for the
empirically obtained null distribution, ![]() . This is given by:
. This is given by:
We intend to study data taken at TR=3 and 1.5 secs.
Six different rest/null datasets (3 normal volunteers, 2 datasets per volunteer) were obtained using TR=3 secs and 9 null datasets
(3 normal volunteers, 3 datasets per volunteer) were
obtained using TR=1.5 secs.
For each dataset 204 echo planar images (EPI) were acquired using
a 3 Tesla system with time to echo (TE) = 30ms, in-plane resolution 4mm
and slice thickness 7mm.
The first 8 scans were discarded to leave ![]() scans and
the data was motion corrected, intensity normalised by subtracting the
global mean time series from each voxel's time series, and non-linear
high-pass filtered. We computed an empirical distribution based on
either all of the TR=3 secs data
or on all of the TR=1.5 secs data. The z-statistics for all of the brain voxels
in the six or nine null datasets are all pooled together to
give one empirical null distribution. The
resulting distributions consisted of
z-statistics from approximately
scans and
the data was motion corrected, intensity normalised by subtracting the
global mean time series from each voxel's time series, and non-linear
high-pass filtered. We computed an empirical distribution based on
either all of the TR=3 secs data
or on all of the TR=1.5 secs data. The z-statistics for all of the brain voxels
in the six or nine null datasets are all pooled together to
give one empirical null distribution. The
resulting distributions consisted of
z-statistics from approximately ![]() voxels. This allowed for examination
into the tail to probabilities as low as
voxels. This allowed for examination
into the tail to probabilities as low as ![]() .
It is important that we examine
this far into the tail of the distribution as this is approximately
where inference needs to
take place when multiple comparison corrections are taken into
account (Worsley et al., 1992).
.
It is important that we examine
this far into the tail of the distribution as this is approximately
where inference needs to
take place when multiple comparison corrections are taken into
account (Worsley et al., 1992).
We will consider two different paradigms - the simple boxcar HRF convolved paradigm (on the TR=3 secs data) and the single-event with randomized ISI design (on the TR=1.5 and 3 secs data) as described earlier. Various autocorrelation estimation techniques will be compared on the calibration plots when performing prewhitening.