


Next: Multi-subject analysis
Up: tr00dl1
Previous: Introduction
In a single-subject fMRI study, one collects, at each voxel, a time series of responses
(intensities of the BOLD signal) to a stimulus, e.g. an ON (condition B) and OFF (condition A)
experiment (box-car design).
Let  , be the time series observed from
  , at a given
voxel. Among the
, at a given
voxel. Among the  values observed at this voxel,
  of them were
recorded while under condition A (OFF or rest condition) and
of them were
recorded while under condition A (OFF or rest condition) and  of
them were recorded while under condition B (ON or stimulation
condition) according to the paradigm.
The observations are assumed to be independent and identically distributed (i.i.d.)4 and to come from a Normal distribution with the same variance
of
them were recorded while under condition B (ON or stimulation
condition) according to the paradigm.
The observations are assumed to be independent and identically distributed (i.i.d.)4 and to come from a Normal distribution with the same variance  and different means
  and
and  for each sample. To decide if there was an activation (at
this voxel) during the experiment, one has to compare the means in the two conditions. If the
difference of the means is big enough relatively to its dispersion, one will assume
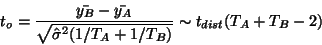
activation. For that purpose is used the following statistic (where the denominator is an estimate
of the standard deviation of the numerator estimating the difference of the means) with its
derived distribution (see appendix A) under the null hypothesis (of no activation
for each sample. To decide if there was an activation (at
this voxel) during the experiment, one has to compare the means in the two conditions. If the
difference of the means is big enough relatively to its dispersion, one will assume
activation. For that purpose is used the following statistic (where the denominator is an estimate
of the standard deviation of the numerator estimating the difference of the means) with its
derived distribution (see appendix A) under the null hypothesis (of no activation  ):
):
 |
(1) |
which means that  comes from (or follows) a Student distribution (
 ) with
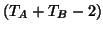 degrees of freedom (df).
  and
and  are the
sample means (i.e.
are the
sample means (i.e.
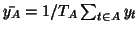 ) and
) and
 is an estimate of the common variance, which is
usually the pooled estimate
is an estimate of the common variance, which is
usually the pooled estimate
 with
with
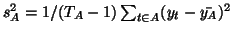 . In fMRI the data is often balanced,
i.e.
. In fMRI the data is often balanced,
i.e. 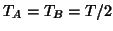 ; thus:
 |
(2) |
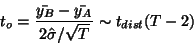
Now following classical hypothesis testing, if the probability
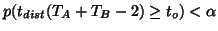 for a chosen level
  (
( 0.05 or 0.01 or 0.001) one rejects the null
hypothesis and decides that the voxel was activated at the level (level of decision not
of activation)5.
Remark:
If you decide (test) that the variances are unequal, the denominator
has to be estimated by
0.05 or 0.01 or 0.001) one rejects the null
hypothesis and decides that the voxel was activated at the level (level of decision not
of activation)5.
Remark:
If you decide (test) that the variances are unequal, the denominator
has to be estimated by
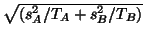 and the
degrees of freedom are approximated by the Satterthwaite
formula[10]:
and the
degrees of freedom are approximated by the Satterthwaite
formula[10]:
![\begin{displaymath}
\frac{[s_A^2/T_A + s_B^2/T_B]^2} {(s_A^2/T_A)^2/(T_A
-1)+(s_B^2/T_B)^2/(T_B -1) }
\end{displaymath}](img27.gif) |
(3) |
but if
the data is balanced and the sample size not too small the departure from equal variances is
usually negligible.
Next: Multi-subject analysis
Up: tr00dl1
Previous: Introduction
Didier Leibovici
2001-03-01