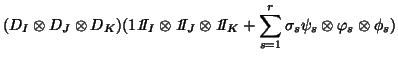
+++++++++++++++++++++++++++++++++++++++++++++++++
 FCA-3modes PTA-3modes   dim x (24) dim y (28) dim z (7)
  data               doses_time x electrodes x  bands
+++++++++++++++++++++++++++++++++++++++++++++++++
 PDY2833  day 1 vs bl vs plb   absolute energy
 means of subjects on the subject scaled data
------------------------------------
     Decomposition after Prin.Tens 222
        explained  99.577455% (FCA 90.453056 %)
    -----------------------------------
VALUES                 PCGLO   PCLOC  PFCA
vs111            1    95.574 %   .     .        vs222    0.0506223    00.245     .    05.534
 Xvs11           1      .      99.51    .        Xvs11   0.0506223      .      82.30    .
 Xvs11   0.0470513    00.212   00.22  04.781     Xvs11   0.0153816    00.023   07.60  00.511
 Xvs22   0.0403039    00.155   00.16  03.508     Xvs22   0.0122856    00.014   04.85  00.326
 Xvs33   0.0218824    00.046   00.05  01.034     Xvs33    0.010821    00.011   03.76  00.253
 Xvs44   0.0173196    00.029   00.03  00.648     Xvs44   0.0059887    00.003   01.15  00.077
 Xvs55   0.0127685    00.016   00.02  00.352     Xvs55   0.0032374    00.001   00.34  00.023
 Xvs66   0.0109674    00.011   00.01  00.260     Xvs66   6.191E-19    00.000   00.00  00.000
 Yvs11           1      .      97.83    .        Yvs11   0.0506223      .      68.24    .
 Yvs11   0.1025283    01.005   01.03  22.700     Yvs11   0.0246204    00.058   16.14  01.309
 Yvs22   0.0746615    00.533   00.55  12.037     Yvs22    0.016941    00.027   07.64  00.620
 Yvs33   0.0568457    00.309   00.32  06.978     Yvs33    0.012839    00.016   04.39  00.356
 Yvs44    0.044454    00.189   00.19  04.267     Yvs44    0.009938    00.009   02.63  00.213
 Yvs55   0.0227088    00.049   00.05  01.114     Yvs55   0.0059792    00.003   00.95  00.077
 Yvs66   0.0196142    00.037   00.04  00.831     Yvs66   3.222E-18    00.000   00.00  00.000
 Zvs11           1      .      99.32    .        Zvs11   0.0506223      .      41.06    .
 Zvs11   0.0448294    00.192   00.20  04.340     Zvs11   0.0337258    00.109   18.22  02.456
 Zvs22   0.0421095    00.169   00.18  03.829     Zvs22    0.032129    00.099   16.54  02.229
 Zvs33   0.0323766    00.100   00.10  02.264     Zvs33    0.022515    00.048   08.12  01.095
 Zvs44   0.0216684    00.045   00.05  01.014     Zvs44    0.015803    00.024   04.00  00.539
 Zvs55   0.0211943    00.043   00.04  00.970     Zvs55   0.0143946    00.020   03.32  00.447
...                                              ....
                                                   --------------------------------------
| ![\scalebox{1}[1]{
\includegraphics[width=4.5cm]{afcmy.ps}
\includegraphics[width=4cm]{afcmz.ps}
\includegraphics[width=5.7cm]{afcmxem.ps}}](img307.gif)