|
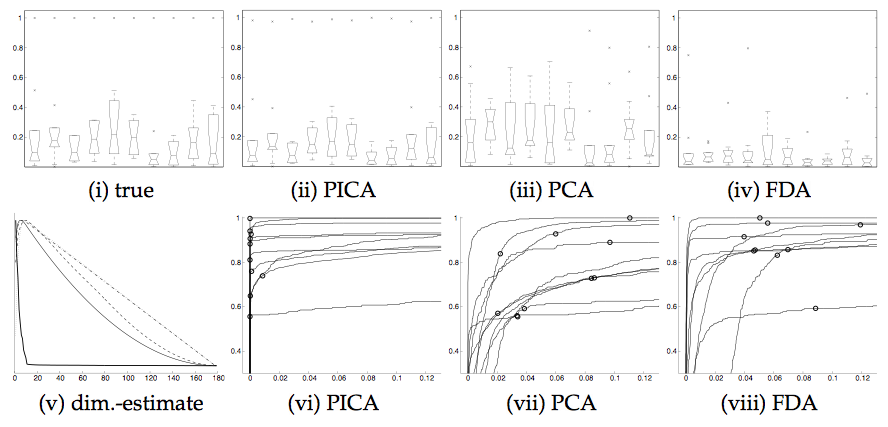
Figure 5 summarises the spatio-temporal accuracy of
the decompositions for all three techniques. For both FDA and PCA, the
first 10 estimated sources were chosen for the comparison; in the case
of PICA the model selection correctly identifies the number true
number of hidden sources (figure
5), so only 10 source signals are estimated. The top
row shows boxplots of the cross-correlation between the 10 true and
the 10 estimated time courses (i.e. the first boxplot summarises the
temporal cross-correlation between source nr. 1 and all other time
courses) while the bottom row shows ROC curves for each of the 10
associated spatial maps.
For both PCA and FDA, the estimated time courses differ substantially
from the 'true' time courses. While in almost all cases both
techniques estimate at least one time course with a significant
correlation, the overall correlation structure is not
preserved (figure 5 (i) compared to (iii) and
(iv)) . This is a simple consequence of the fact that both PCA and
FDA estimate orthogonal sets of time courses. Note that FDA appears to
perform worse in terms of the estimation of the time courses but
outperforms PCA in the spatial domain. In the case of PICA, the
underlying sources are much better identified, both in the temporal
and the spatial domain: the correlation structure of the
estimated time courses is close to that of the true source signals. At
the same time the PICA decomposition results in an improved ROC
characteristics with highest true-positive rates at any false-
positives level. In almost all cases the canonical threshold level of
0.5 results in 0 false positives. In this case, the difference
between PICA and PCA is purely due to the
additional orthogonal rotation matrix
![]() . In the case of PICA the
underlying sources are much better identified in that in all cases
exactly one of the estimated time courses has a very high correlation
with the true signal time course. Consequently, the covariance
structure between different time courses is almost identical to the
true covariance structure.
It is interesting to note that, in all cases, the estimated
time courses have a slightly smaller cross-covariance structure than
the true time courses. This is an effect quite different to the
assumptions that lead into the investigation of 'Spatiotemporal
Independent Component Analysis' [Stone et al., 2002] . There, the authors
speculated that in in the case of an ICA decomposition based on
optimising spatial independence between estimated source signals,
suboptimal solutions emerge since the decomposition will tend towards
unplausible solutions in the 'dual' temporal domain in order to
satisfy the independence in the spatial domain. In our experience,
however, spatial and temporal accuracy appear to be strongly related.
This is, in fact, what is to be expected given the uniqueness results
presented earlier.
. In the case of PICA the
underlying sources are much better identified in that in all cases
exactly one of the estimated time courses has a very high correlation
with the true signal time course. Consequently, the covariance
structure between different time courses is almost identical to the
true covariance structure.
It is interesting to note that, in all cases, the estimated
time courses have a slightly smaller cross-covariance structure than
the true time courses. This is an effect quite different to the
assumptions that lead into the investigation of 'Spatiotemporal
Independent Component Analysis' [Stone et al., 2002] . There, the authors
speculated that in in the case of an ICA decomposition based on
optimising spatial independence between estimated source signals,
suboptimal solutions emerge since the decomposition will tend towards
unplausible solutions in the 'dual' temporal domain in order to
satisfy the independence in the spatial domain. In our experience,
however, spatial and temporal accuracy appear to be strongly related.
This is, in fact, what is to be expected given the uniqueness results
presented earlier.