Using only one of these 1000 datasets we drew 1000 samples from the posterior pdf on principal diffusion direction at each voxel under both the diffusion tensor, and simple partial volume models. From these samples, we computed the same 95% angle from the mean direction.
Figure 3 shows these 95% angles for the diffusion tensor model in (a), and the partial volume model in (b). (c) shows the same angles predicted by Jones' method.
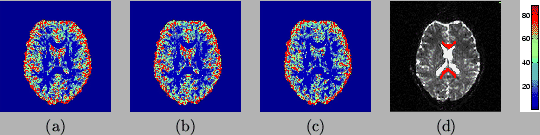 |
There are various factors to consider when comparing these results. The first is that the empirical method in (c) is not necessarily ``ground truth''. It has errors associated with it due to subject motion and interpolation related effects, but also, more subtly, due to the dependence within the bootstrapped datasets. This is likely to cause an underestimate in the measured uncertainty. The second factor is the difference in the two models. (a) and (c) predict uncertainty levels in the principal eigenvector of a diffusion tensor model. (b) predicts the same thing for the less flexible partial volume model. In areas of complex fibre structure, the partial volume model, which has only one fibre direction available to it, is forced to represent this structure as uncertainty in the single direction (this will turn out to be extremely useful when trying to do tractography, as will be seen in later sections. In contrast, the diffusion tensor model will tend to account for complex fibre structure in a voxel not only with uncertainty in the principal fibre direction, but also with a change in the diffusion profile (i.e. a change in the relative sizes of the three eigenvectors). For this reason we would predict that, in regions of complex fibre structure, the partial volume model would show more uncertainty in principal diffusion direction than the diffusion tensor model. We would expect the two models to predict very similar uncertainties in regions of high fibre co-alignment, such as in the corpus callosum (Figure 3 (d)).
The mean 95% confidence angles within the brain for the three methods
are: diffusion tensor model and MCMC (a)
![]() , partial volume
model and MCMC (b)
, partial volume
model and MCMC (b)
![]() and diffusion tensor model with
empirical measurements (Jones)(c)
and diffusion tensor model with
empirical measurements (Jones)(c)
![]() . We further compare any two
of these three methods by computing their absolute difference as a
fraction of their mean value at every voxel, defining fractional
deviation (Table 1):
. We further compare any two
of these three methods by computing their absolute difference as a
fraction of their mean value at every voxel, defining fractional
deviation (Table 1):
 |
|
||||||||||||||||||||||||||||||||||
| Table 1:Fractional Deviation values between the three methods in the | ||||||||||||||||||||||||||||||||||
| whole brain (left) and within the Corpus Callosum (right). Inside each | ||||||||||||||||||||||||||||||||||
| cell is the mean with the median in parentheses. |
Predictions of uncertainty by MCMC on the two models are within 10% of each other throughout the brain, and within 5% in the callosal mask, showing, as predicted, very similar uncertainty where fibers are highly co-aligned, and slight differences in uncertainty in other areas. With the diffusion tensor model, uncertainties predicted by MCMC are within 15% of those predicted by the empirical method when considering the whole brain, and 13% when only considering the corpus callosum. These differences are small and may be due to errors in either or both approaches.