Next: Discussion
Up: Results
Previous: Multi-session FMRI data
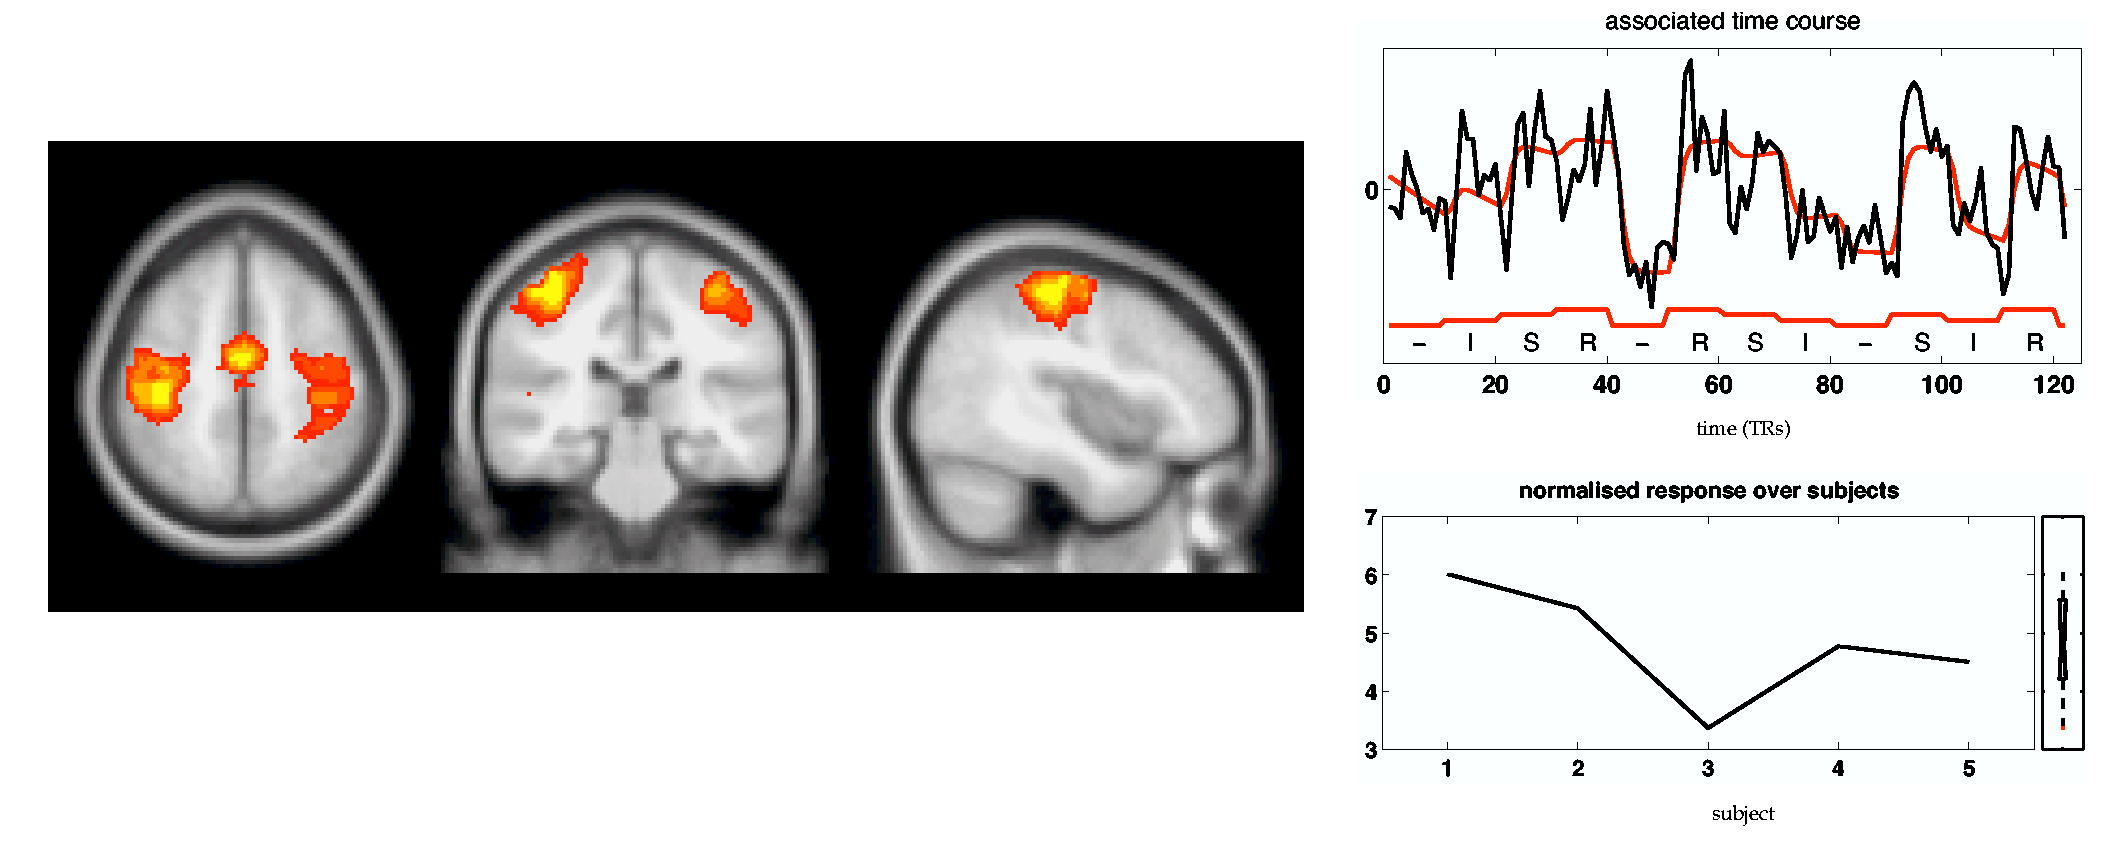
The primary activation map for the multi-subject motor activation study is shown in figure 13![[*]](icons/crossref.png) . The estimated spatial map shows somatosensory cortex and bilateral primary and secondary motor cortex. Though both left and right motor cortex are shown to activate, the contra-lateral side shows larger amplitude modulation. The associated time course is shown together with the best fit with a 3-level general linear model, where 'activation' during index finger movement (I), sequential finger movement (S) and random finger movement (R) are separate explanatory variables. The corresponding regression parameters are
. The estimated spatial map shows somatosensory cortex and bilateral primary and secondary motor cortex. Though both left and right motor cortex are shown to activate, the contra-lateral side shows larger amplitude modulation. The associated time course is shown together with the best fit with a 3-level general linear model, where 'activation' during index finger movement (I), sequential finger movement (S) and random finger movement (R) are separate explanatory variables. The corresponding regression parameters are  (I),
(I),  (S) and
  (R), suggesting an increase in activation levels I
 SR consistent with results obtained from a GLM analysis of the data (see [Johansen-Berg et al., 2002] for details). The final model fit correlates with the estimated data time course at
  .
.
|
Figure 13:
Thresholded tensor-PICA map and associated time course for the multi-subject FMRI data set. Post-thresholded areas include primary and secondary motor areas and SMA. The associated time course is shown together with the best model fit based on linear regression of the estimated temporal mode against the GLM design with 3 exploratory variables (modelling index finger movement (I), sequential finger movement (S) and random finger movement (R) separately).
Christian Beckmann
2004-12-14