 (i) GLM |
 (ii) PARAFAC |
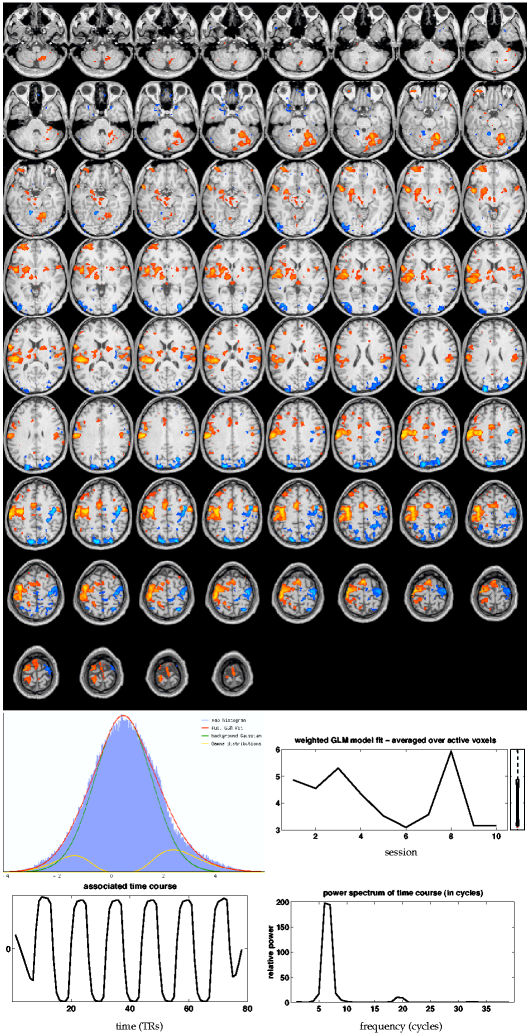
The results for GLM are shown in figure
8![]() (i) (all maps are shown in neurological convention,
i.e. left hemisphere is displayed on the left). Similar to the thresholded
(i) (all maps are shown in neurological convention,
i.e. left hemisphere is displayed on the left). Similar to the thresholded ![]() -stat maps
presented in the original paper by [McGonigle et al., 2000], the
super-thresholded clusters coincide with areas typically involved in
motor processing: bilateral premotor, contra-lateral primary motor and sensory areas, SMA, bilateral secondary
somatosensory and the ipsilateral anterior lobe of the cerebellum. Based on the
Gaussian/Gamma mixture model fit, significantly negative
group-level
-stat maps
presented in the original paper by [McGonigle et al., 2000], the
super-thresholded clusters coincide with areas typically involved in
motor processing: bilateral premotor, contra-lateral primary motor and sensory areas, SMA, bilateral secondary
somatosensory and the ipsilateral anterior lobe of the cerebellum. Based on the
Gaussian/Gamma mixture model fit, significantly negative
group-level ![]() -scores are found in ipsilateral primary motor areas, bilateral
intra-parietal sulcus and occipital parietal cortex
(blue). Below the GLM map is the first-level GLM regressor together with its power spectrum. Also shown is the normalised (to
unit standard deviation) set of first level parameter estimates,
weighted by the group-level
-scores are found in ipsilateral primary motor areas, bilateral
intra-parietal sulcus and occipital parietal cortex
(blue). Below the GLM map is the first-level GLM regressor together with its power spectrum. Also shown is the normalised (to
unit standard deviation) set of first level parameter estimates,
weighted by the group-level ![]() -scores and averaged within post-threshold group-level activation clusters. At the group
level, the averaged and weighted set of first-level estimates
expresses the change in effect 'strength' between different sessions
similar to what is estimated explicitly as part of the PARAFAC and
tensor-PICA decomposition as the third mode,
-scores and averaged within post-threshold group-level activation clusters. At the group
level, the averaged and weighted set of first-level estimates
expresses the change in effect 'strength' between different sessions
similar to what is estimated explicitly as part of the PARAFAC and
tensor-PICA decomposition as the third mode,
![]() (see [Smith et al., 2004] for examples of the usefulness of this quantity in the context of model-based FMRI group analysis).
(see [Smith et al., 2004] for examples of the usefulness of this quantity in the context of model-based FMRI group analysis).
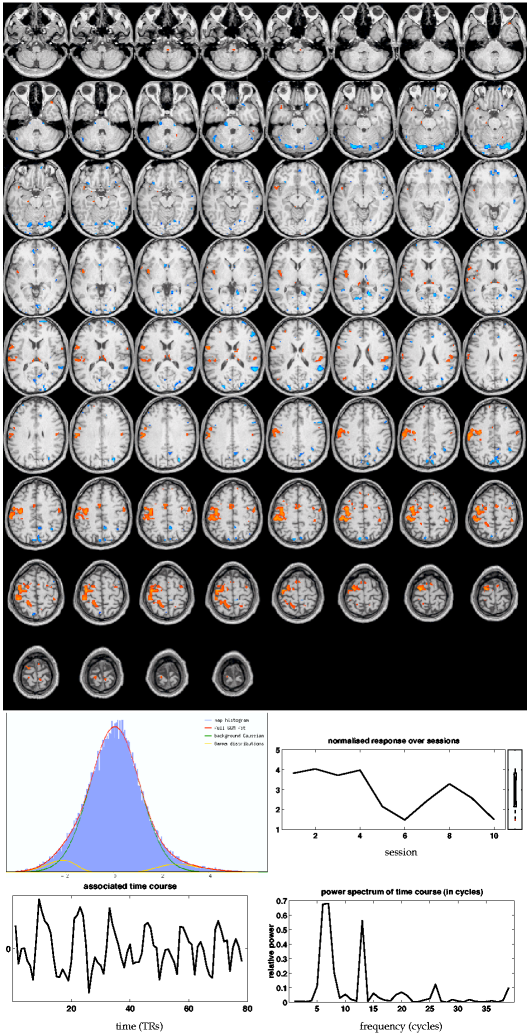
The main PARAFAC map8 in figure 8![]() (ii) similarly shows super-thresholded
clusters in premotor and motor areas, but shows fewer voxels in
secondary somatosensory areas and does not identify
an ipsilateral cluster in the cerebellar cortex. The power spectrum of
the associated time course has highest power at the fundamental
frequency of the design (6.5 cycles) but also large power at the first
harmonic and some higher frequencies.
(ii) similarly shows super-thresholded
clusters in premotor and motor areas, but shows fewer voxels in
secondary somatosensory areas and does not identify
an ipsilateral cluster in the cerebellar cortex. The power spectrum of
the associated time course has highest power at the fundamental
frequency of the design (6.5 cycles) but also large power at the first
harmonic and some higher frequencies.
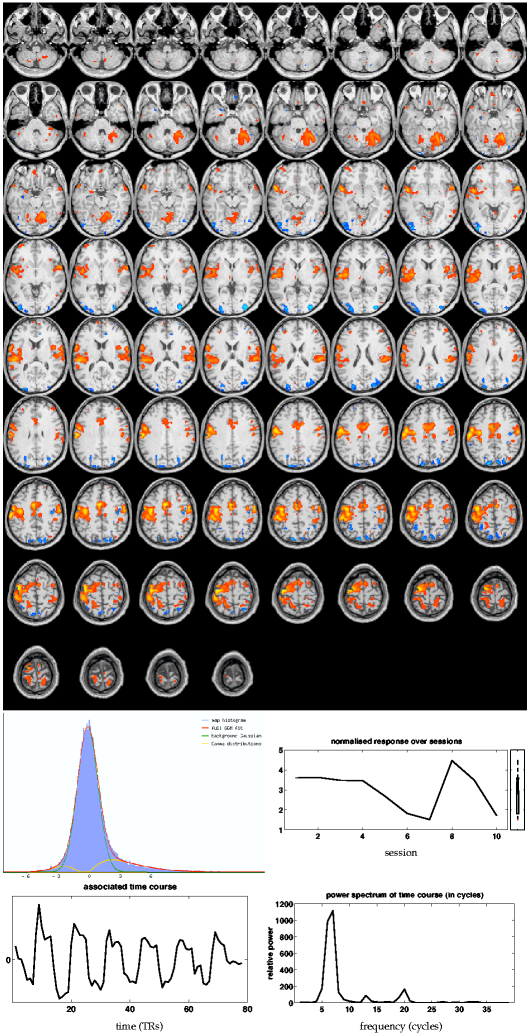
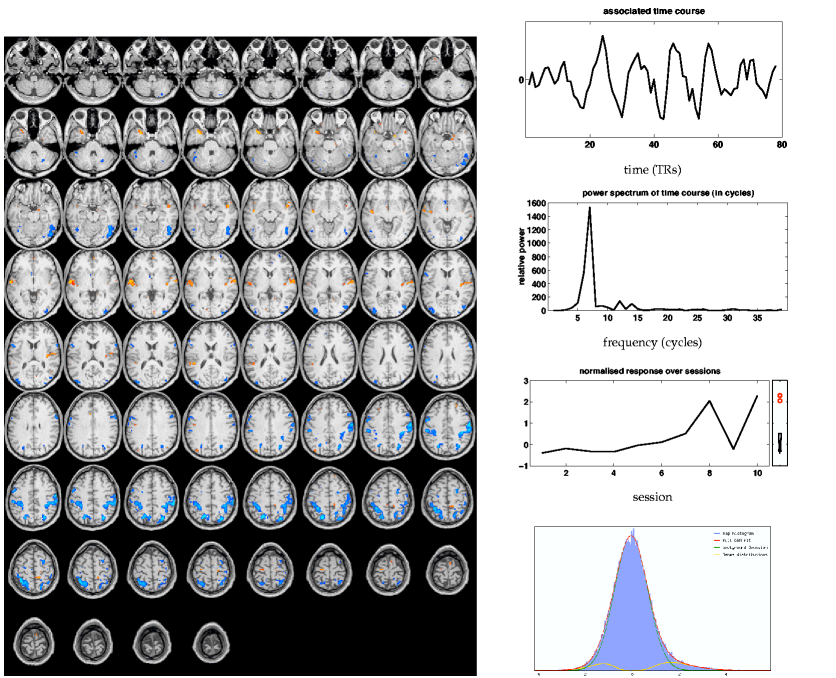
By comparison, the primary tensor-PICA map (figure 9![]() (i))
shows much larger correlation with the GLM map than the main
PARAFAC map.
The spatial map from
tensor-PICA shows areas similar to the GLM mixed-effects map, with
the tensor-PICA map more prominently showing clusters in bilateral secondary
somatosensory (S2) areas. Additionally, cingulate motor and
ipsilateral primary motor areas have survived thresholding.
Among the 19 estimated sources, this process has not only the highest spatial correlation with
the GLM map, but also the highest temporal correlation with the GLM design
and highest mean effect size.
The rank-1 approximation
explains of the variation between the temporal responses for
each of the sessions.
Similar to the PARAFAC results, there is some correspondence between the
normalised9 estimated session response (bottom) and the weighted
averaged GLM first-level parameter estimates (figure 8
(i))
shows much larger correlation with the GLM map than the main
PARAFAC map.
The spatial map from
tensor-PICA shows areas similar to the GLM mixed-effects map, with
the tensor-PICA map more prominently showing clusters in bilateral secondary
somatosensory (S2) areas. Additionally, cingulate motor and
ipsilateral primary motor areas have survived thresholding.
Among the 19 estimated sources, this process has not only the highest spatial correlation with
the GLM map, but also the highest temporal correlation with the GLM design
and highest mean effect size.
The rank-1 approximation
explains of the variation between the temporal responses for
each of the sessions.
Similar to the PARAFAC results, there is some correspondence between the
normalised9 estimated session response (bottom) and the weighted
averaged GLM first-level parameter estimates (figure 8![]() (i), bottom).
(i), bottom).
 (i) primary tensor-PICA map |
 (ii) secondary tensor-PICA map |
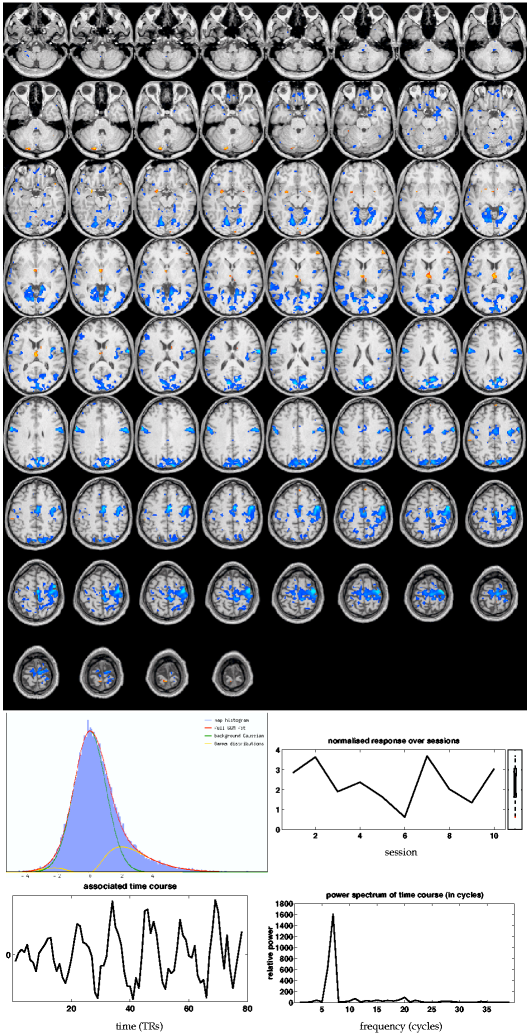
The ''negative'' activation in the GLM map (e.g. ipsilateral
motor areas) no longer shows up in this map but is contained
within a separate tensor-PICA map10 shown in
figure 10![]() (ii). The most strongly de-activated areas include
the ipsilateral primary motor areas and somatosensory areas, possibly
de-activating 'non-hand' motor areas as shown previously for the
somatosensory system [Drevets et al., 1995]. The plot of the normalised response
size over sessions does show that this de-activation is consistent
over sessions. The amount of explained variance in the rank-1
approximation , however, is reduced
to
(ii). The most strongly de-activated areas include
the ipsilateral primary motor areas and somatosensory areas, possibly
de-activating 'non-hand' motor areas as shown previously for the
somatosensory system [Drevets et al., 1995]. The plot of the normalised response
size over sessions does show that this de-activation is consistent
over sessions. The amount of explained variance in the rank-1
approximation , however, is reduced
to ![]() , suggesting that, unlike primary activation, the
de-activation is less consistent in the temporal characteristics
between sessions.
, suggesting that, unlike primary activation, the
de-activation is less consistent in the temporal characteristics
between sessions.
Some parts of the de-activation as identified in the GLM analysis (blue in figure ![]() (i)), however,
do not appear in the primary de-activation map shown in figure 9
(i)), however,
do not appear in the primary de-activation map shown in figure 9![]() (ii). Instead, a third
tensor-PICA map (with correlation of
(ii). Instead, a third
tensor-PICA map (with correlation of ![]() to the GLM
design) shows de-activation in the superior occipital lobule, an area commonly involved in stereo vision (see figure 10
to the GLM
design) shows de-activation in the superior occipital lobule, an area commonly involved in stereo vision (see figure 10![]() ). Unlike the
de-activation depicted in figure 9
). Unlike the
de-activation depicted in figure 9![]() (ii), only a
few of the 10 sessions show a significantly non-zero effect size: the
boxplot shows sessions 8 and 10 as 'outliers', possibly due to visual fixation.
(ii), only a
few of the 10 sessions show a significantly non-zero effect size: the
boxplot shows sessions 8 and 10 as 'outliers', possibly due to visual fixation.
|
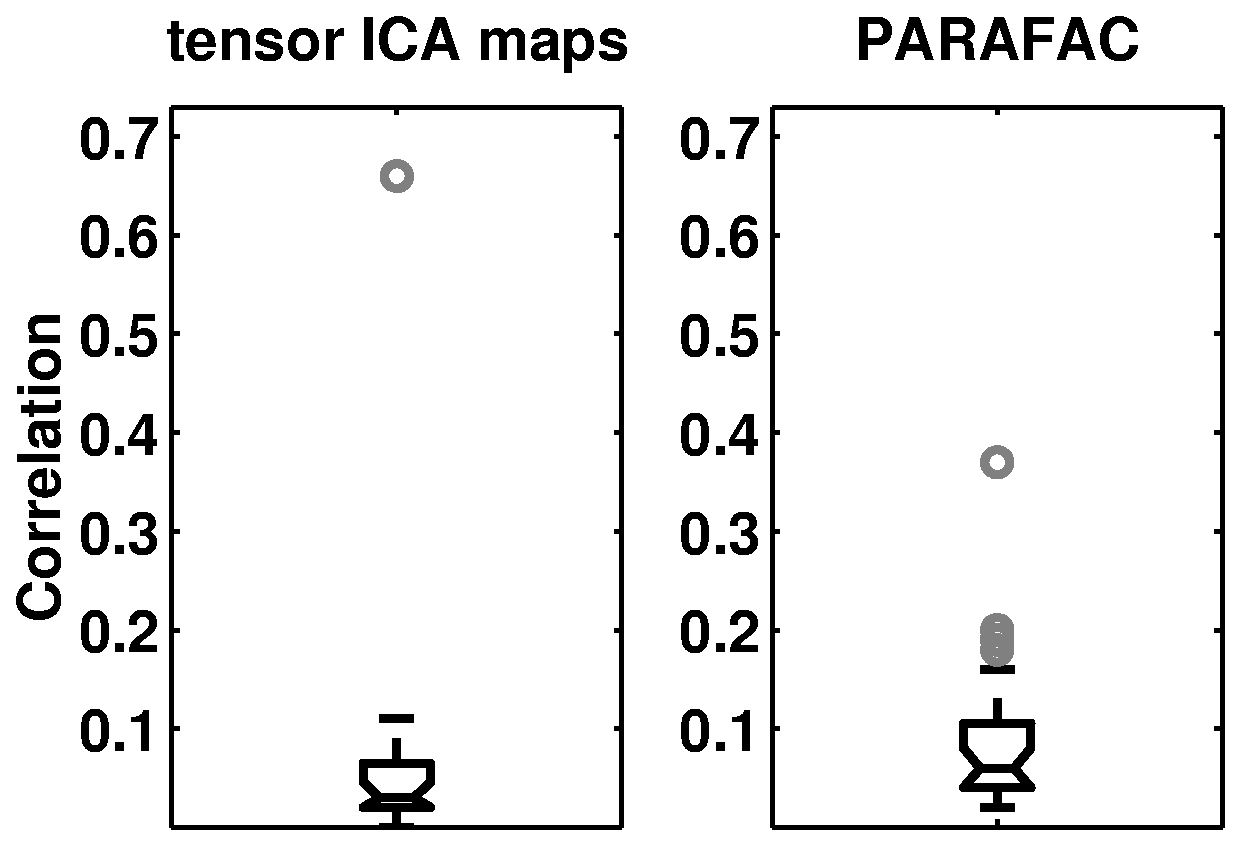
Similar to the case of the artificial data, figure 11![]() demonstrates that the tensor-PICA
results show a much clearer identification of a single
``activation'' map as well as reduced cross-talk between estimated maps.
demonstrates that the tensor-PICA
results show a much clearer identification of a single
``activation'' map as well as reduced cross-talk between estimated maps.
|
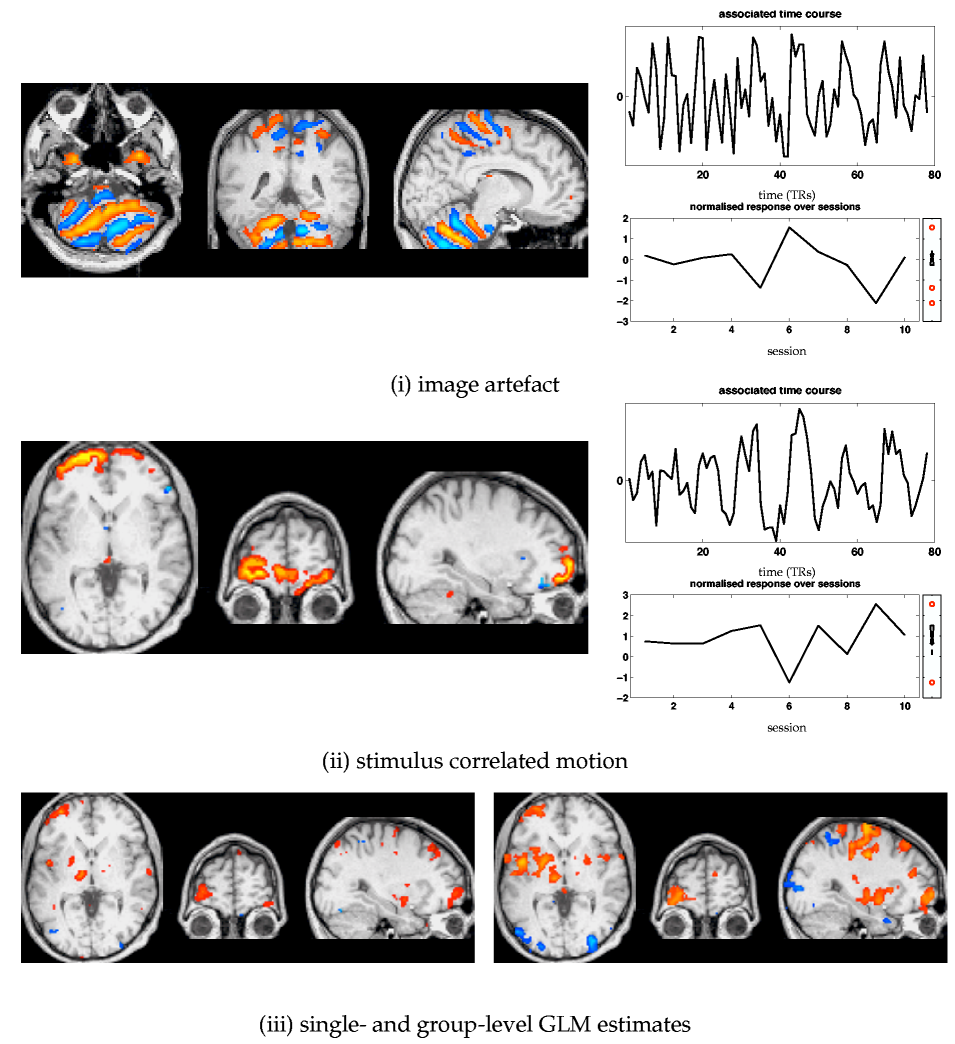
Additional 'interesting' maps from the tensor-PICA decomposition are shown in figure 12![]() :
the first map (i) depicts the spatial extent of an image artefact showing signal fluctuations possibly due to RF signal aliased into the field-of-view. While the exact origin of these signal components is unknown, they negatively impact on a group GLM analysis as these pattern induce additonal error variance.
Figure 12
:
the first map (i) depicts the spatial extent of an image artefact showing signal fluctuations possibly due to RF signal aliased into the field-of-view. While the exact origin of these signal components is unknown, they negatively impact on a group GLM analysis as these pattern induce additonal error variance.
Figure 12![]() (ii) shows stimulus-correlated residual head
motion, most clearly appearing at the frontal lobe intensity
boundaries. The presence of this artefact strongly impacts on standard
GLM analysis: both the single-level (for session 6) and the
group-level GLM estimates for motor activation show false positives
around the area where the tensor-PICA map shows the residual motion.
Though only a few sessions are estimated to contain this spatio-temporal
process, the amplitude modulation induced by the artefacts within
these sessions is large enough to be significant even at the group
level.
(ii) shows stimulus-correlated residual head
motion, most clearly appearing at the frontal lobe intensity
boundaries. The presence of this artefact strongly impacts on standard
GLM analysis: both the single-level (for session 6) and the
group-level GLM estimates for motor activation show false positives
around the area where the tensor-PICA map shows the residual motion.
Though only a few sessions are estimated to contain this spatio-temporal
process, the amplitude modulation induced by the artefacts within
these sessions is large enough to be significant even at the group
level.
|