[18] does not include any such statement as ``session variability is high'', or even any quantification explicitly suggesting in a simple way that session variability is a serious problem; nevertheless, unfortunately, many researchers (e.g., [6,4]) seem to have taken these messages from the paper. One of the causes of this is the apparent variability in Figures 2-4 (in [18]), which show, for each paradigm, each session's thresholded activation image (as a single sagittal slice maximum intensity projection). All three figures give the impression of large intersession variability, even for the strong visual paradigm.
The most important point to make with respect to this issue is that it is not safe to judge intersession variability by looking at variability in thresholded statistic images. It is perfectly possible for two unthresholded activation images to not be statistically significantly different and yet one contain activation just over threshold and the other just under, giving the false impression of large variability. The fact that thresholds are in any case chosen arbitrarily increases the weakness of this method of judging variability.
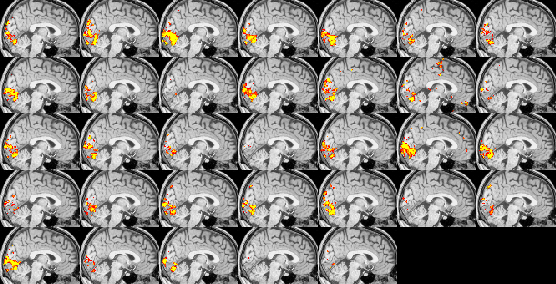
To illustrate these issues, Figures 6
and 7 show single-session thresholded images from
analysis F of the visual experiment. Figure 6 is created
using the same threshold as in [18], namely p![]() 0.05,
corrected for multiple comparisons using Gaussian random field
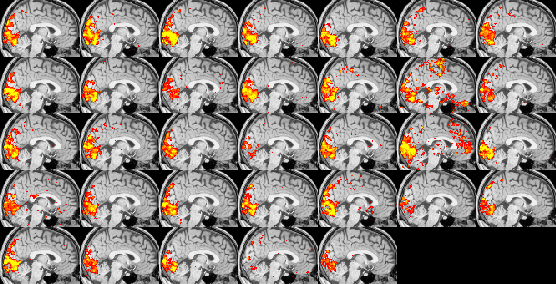
theory [11]. In contrast, Figure 7 is
created using a reduced threshold (the t threshold used in
Figures 6 is reduced by 33%). Obviously there is more
apparent activation when the threshold is reduced (though, note that
it has clearly not been reduced so far that there is generally a huge
amount of spatially variable ``noise'' activation caused by
this). However, the interesting point is that the subjective
impression of intersession variability is much reduced.
0.05,
corrected for multiple comparisons using Gaussian random field
theory [11]. In contrast, Figure 7 is
created using a reduced threshold (the t threshold used in
Figures 6 is reduced by 33%). Obviously there is more
apparent activation when the threshold is reduced (though, note that
it has clearly not been reduced so far that there is generally a huge
amount of spatially variable ``noise'' activation caused by
this). However, the interesting point is that the subjective
impression of intersession variability is much reduced.
 |
 |
Finally, a question arises as to why Figure 6, which should match the original figure in [18] (having been processed in the same manner) appears to show less variability than the original figures. This was found to be due to the fact that suboptimal timing was used in the original model generation (caused by a particular default setting of the point within a TR that the model is sampled, which also corresponds to the point during a TR when that time point's whole FMRI volume is assumed to have been instantaneously sampled; this default was changed between SPM99 and SPM99b). The re-analysis was more efficient at estimating activation as better-matched models were used, causing less apparent inter-session variability. As part of the investigation of this effect, we tested the variability in peak Z values as the model timing was changed slightly. The mean across sessions(max across space(Z)) value for 5 different phase shifts of the model (-1 TR to +1 TR) were found to be 6.6, 7.5, 7.9, 7.5, 6.9 (model timing running from earlier to later respectively). This is quite a large effect for these phase shifts, given that the paradigm is a block design. This is another illustration of the danger of judging variability solely on the basis of thresholded results.