


Next: Intersession Effect Size Plots
Up: Results and Discussion
Previous: Results and Discussion
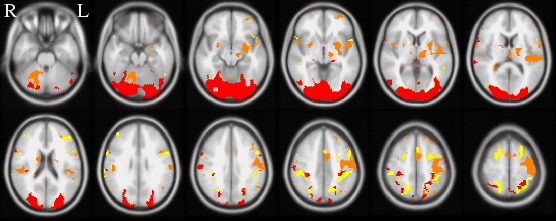
The FE-based mask images (used to define the voxels used in the
quantitative analyses reported below) are shown in
Figure 3, overlaid onto the MNI152 standard head
image.
Figure 3:
Masks of potentially activated voxels, within which mean ME-Z
was calculated for each analysis method; red=visual, orange=motor, yellow=cognitive.
 |