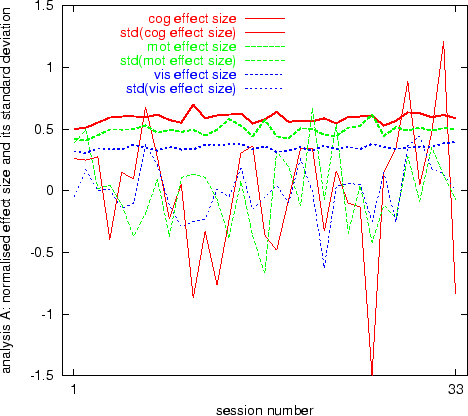
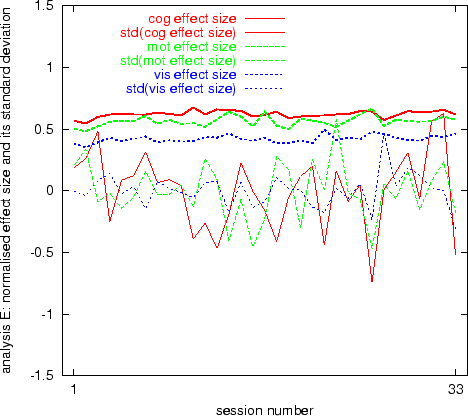
For analysis methods A and E we now show the effect size and its (fixed effects, within-session) temporal standard deviation, as a function of session number. Both the effect size and the temporal standard deviation are estimated as means over interesting voxels, as defined above. The plots were normalised by estimating the mean effect size over all sessions, scaling this to be unity, scaling the standard deviation by the same factor, and demeaning the effect size plot. See Figures 4 and 5. These plots show (as does the following section) that the within-session variance has similar magnitude to the inter-session variance. They also show that variability in effect size is higher than variability in its standard deviation (though the implication of this fact is not necessarily important to the primary points of this paper). Note that the results presented here correspond to the ``uncorrected'' plot in Figure 8.
 |
 |